. 2025 Sep 6;28(10):113518.
doi: 10.1016/j.isci.2025.113518. eCollection 2025 Oct 17.

Dynamic neural compensation for distorted orientation perception in chronic astigmatism

Affiliations

Dynamic neural compensation for distorted orientation perception in chronic astigmatism

Sangkyu Son et al. iScience. .

Abstract

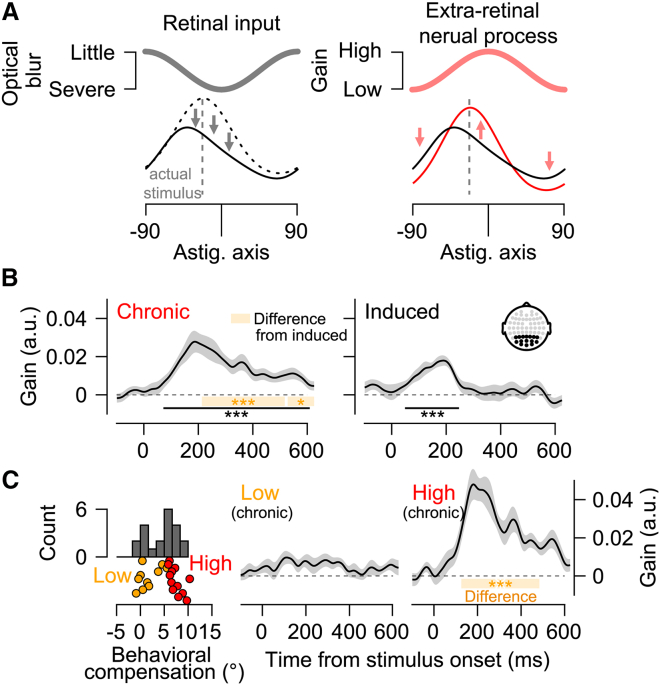
Astigmatism induces orientation-specific blur, distorting retinal inputs, and biasing perception. Yet individuals with chronic astigmatism often perceive orientation accurately, though the underlying neural mechanisms remain unclear. We investigated how the brain compensates for this distortion by recording electroencephalogram (EEG) responses from 42 participants (15 females) under astigmatic viewing conditions. Using multivariate EEG decoding and a computational model, we reconstructed population orientation tuning curves and identified neural modulation not explained by retinal inputs alone. Chronic astigmatism enhanced neural sensitivity to blurred orientations and suppressed responses to intact ones, forming a push-pull modulation pattern correlated with perceptual accuracy. This modulation dynamically propagated from posterior to anterior brain regions after stimulus onset and predicted the perceptual compensation. In contrast, short-term exposure produced weak, transient modulation, and an opposite anterior-to-posterior propagation pattern without perceptual relevance. These findings show that long-term visual distortion reshapes neural tuning and inter-regional dynamics, enabling perceptual optimization through cortical plasticity.

Keywords: Neuroscience; Sensory neuroscience.


Conflict of interest statement

Authors declare that they have no competing interests.

Figures

None
Graphical abstract
Figure 1
Figure 1
Experimental design (A) Impact of astigmatic optical deformation on orientation information. Light rays passing through an angle perpendicular to the astigmatic axis undergo greater refraction and focus before reaching the retina (red lines). This result in an elliptical optical blur, causing the orientation of the Gabor stimulus on the retina to appear tilted away from the astigmatic axis (red arrow). Astigmatic vision was simulated either through the participant’s own chronic astigmatism (referred to as chronic) or by experimentally inducing an astigmatic refractive error in individuals with normal vision (referred to as induced). (B) Participants were presented with randomly tilted Gabor stimuli at the fovea. After a brief presentation, they reported the perceived mean orientation by adjusting an orientation bar.
Figure 2
Figure 2
Optics-based model and the effect of astigmatism on orientation perception (A) Optics-based model of astigmatic vision. First column: the optically blurred retinal image in astigmatic vision was simulated by convolving the visual stimulus with an elliptical-shaped kernel. The ellipticity of the kernel was estimated based on each participant’s cylindrical refractive errors. From the retinal image, population orientation tuning responses were estimated from a composite of hypothetical neurons with varying orientation and spatial frequency preferences. Second column, left: The population tuning responses to the presented stimulus orientation (−45°) are shown as a red solid line. The dashed red line represents the presented stimulus orientation, while tuning responses to other orientations are shown as gray solid lines. Second column, right: the predicted response to the presented orientation is centered at 0°, while responses to orientations near the orthogonal axis and the astigmatic axis are positioned to the left and right, respectively. Third column: The predicted behavioral responses were estimated from the mean orientation of the model’s population responses. Behavioral bias was calculated as the difference between the presented stimulus orientation and the model prediction. The red circle indicates the predicted bias for the example stimulus (−45°), while gray circles represent predicted biases for other stimulus orientations. (B) Perceptual biases (differences between the presented stimulus orientations and the reported orientations) of the chronic group (solid red lines), the induced group (solid black lines), and the optics-based model prediction (dashed lines) as a function of deviation from the astigmatic axis. The shaded regions represent ±1 SEM.
Figure 3
Figure 3
Restoration of the neural orientation tuning responses in chronic astigmatic vision (A) Orientation tuning responses measured between 250 and 350 ms after stimulus onset. Data from four example participants are shown, with the two participants on the left belonging to the chronic group and the two on the right belonging to the induced group. Orientation tuning responses to the same oblique orientation stimulus are shown under both astigmatic (red) and emmetropic (black) vision conditions. The red dashed vertical lines indicate the orientation orthogonal to the astigmatic axis, where optical blur is expected to introduce a bias, while the black dashed vertical lines represent the actual stimulus orientation. (B) Average orientation tuning responses across participants between 250 and 350 ms relative to stimulus onset. Tuning responses to all oblique orientations relative to the astigmatic axis were realigned such that the response to the actual stimulus is centered, with the orientation orthogonal to the astigmatic axis positioned on the left side. (C) Orientation tuning responses to oblique orientations (relative to the astigmatic axis) as a function of time in the chronic (left) and induced (right) groups. The inset topography denotes the posterior electrodes used in the analysis. The subfigures below show skewness and the strength of the orientation response in the tuning. Von Mises functions were fitted for visualization purposes only. Black lines indicate time intervals where accuracy or skewness was significantly different from zero. All shaded regions represent ±1 SEM, and stars denote statistical significance (∗, p < 0.05; ∗∗, p < 0.01; ∗∗∗, p < 0.001).
Figure 4
Figure 4
Neural gain modulation restores the orientation perception in astigmatic vision (A) Left: The retinal input is degraded around the astigmatic axis, distorting the orientation tuning response. As a result, the tuning function for the stimulus orientation (dashed line) becomes skewed (solid line). Right: If the extra-retinal neural process selectively increases the gain of neural responses to orientations near the astigmatic axis while decreasing the gain for orientations orthogonal to it, the skewed tuning response (black line; identical to the one on the left) can be restored to a more symmetrical shape (red line), effectively reversing the effects of optical blur. (B) Quantification of gain modulation estimated from the model shown in Figure 2. The black line indicates time intervals where gain modulation is significantly different from zero. The orange shading highlights periods during which gain modulation in the chronic condition significantly differs from that in the induced condition. The inset topography indicates the posterior electrodes used in the analysis. (C) Temporal evolution of gain modulation in the chronic astigmatism group, comparing participants with high versus low behavioral compensation. The orange shading along the bottom denotes time intervals where gain modulation in the high compensation group is significantly different from that in the low compensation group. Each dot denotes one participant. All shaded regions represent ±1 SEM. The number and color of stars indicate statistical significance (∗, p < 0.05; ∗∗, p < 0.01; ∗∗∗, p < 0.001), with black denoting a one-sample t test from zero and orange denoting a paired t test across groups.
Figure 5
Figure 5
Transference of gain modulation in the chronic astigmatism group (A) In the chronic astigmatism group, the searchlight approach unveiled a broad distribution of gain modulation originating from the posterior channels. (B) Bottom: Temporal transition of push-pull gain modulation across channels in the chronic astigmatism group compared to the induced astigmatism group. Each element represents the relative strength of gain transfer from an electrode in the corresponding column at a specific time point (pre-channel) to another electrode in the corresponding row at the subsequent time point (post-channel). Significant values are highlighted by contours around the red elements (p < 0.05). Values were averaged between 100 and 300 ms after stimulus onset. The brightness of the gray bars alongside each row and column of the matrix represents the spatial position of the channel along the anterior-posterior axis, as indicated by the inset topography (lighter gray: more posterior channels, darker gray: more anterior channels). Top: The transition matrix from the bottom subfigure was visualized by plotting pre-channels as circles on a hypothetical brain, with lines connecting them to their respective post-channels. Gain modulation transference in the posterior-to-anterior direction (upper triangle of the bottom matrix) is marked in red, while transference in the anterior-to-posterior direction (lower triangle of the bottom matrix) is marked in orange. Only transference exhibiting more than a 13% relative change is illustrated. (C) The strength of the push-pull gain modulation transition varies based on the degree of behavioral compensation.
Figure 6
Figure 6
Gain modulation transference in the induced astigmatism group (A) Gain modulation estimated from the model orientation tuning responses was computed separately for the first and second halves of the experiment (each lasting approximately 1 h). All shaded regions represent ±1 SEM and stars indicate statistical significance (∗∗, p < 0.01). The subfigure indicates the electrode used. (B) Relative changes in the temporal transition of push-pull gain modulation across channels, comparing the first half with the second half of the experiment (bottom), along with its visualization (top). Significant values are highlighted by contours around the red cluster (p < 0.05).

References

    1. Radhakrishnan A., Dorronsoro C., Sawides L., Webster M.A., Marcos S. A cyclopean neural mechanism compensating for optical differences between the eyes. Curr. Biol. 2015;25:R188–R189. doi: 10.1016/j.cub.2015.01.027. - DOI - PMC - PubMed
    1. Webster M.A., Georgeson M.A., Webster S.M. Neural adjustments to image blur. Nat. Neurosci. 2002;5:839–840. doi: 10.1038/nn906. - DOI - PubMed
    1. Barbot A., Park W.J., Ng C.J., Zhang R.-Y., Huxlin K.R., Tadin D., Yoon G. Functional reallocation of sensory processing resources caused by long-term neural adaptation to altered optics. eLife. 2021;10 doi: 10.7554/eLife.58734. - DOI - PMC - PubMed
    1. Ohlendorf A., Tabernero J., Schaeffel F. Neuronal adaptation to simulated and optically-induced astigmatic defocus. Vision Res. 2011;51:529–534. doi: 10.1016/j.visres.2011.01.010. - DOI - PubMed
    1. Vinas M., Sawides L., de Gracia P., Marcos S. Perceptual adaptation to the correction of natural astigmatism. PLoS One. 2012;7 doi: 10.1371/journal.pone.0046361. - DOI - PMC - PubMed

LinkOut - more resources