. 2025 Sep 20;21(13):5802-5820.
doi: 10.7150/ijbs.110790. eCollection 2025.

The KLF4/Galectin-3 cascade is a key determinant of tubular cell death and acute kidney injury

Affiliations

The KLF4/Galectin-3 cascade is a key determinant of tubular cell death and acute kidney injury

Lishan Liu et al. Int J Biol Sci. .

Abstract

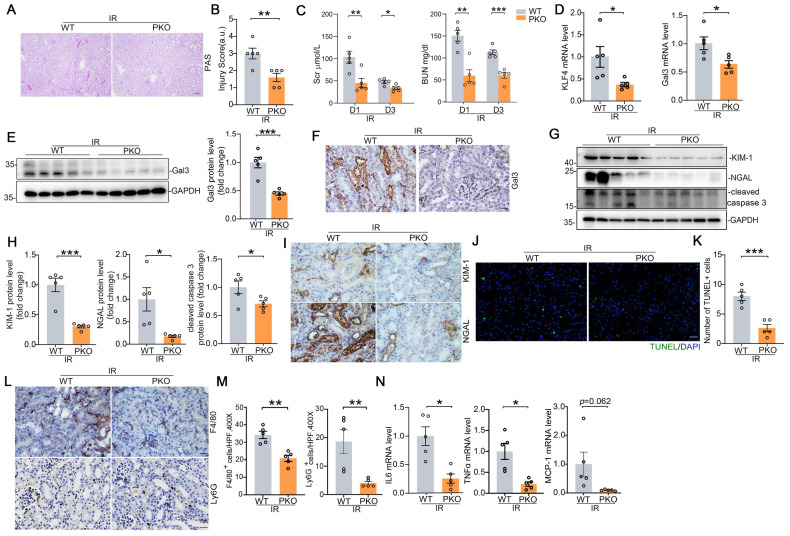
Clinically, acute kidney injury (AKI) stems from a diverse array of causes including ischemia, exposure to nephrotoxic agents, or sepsis. Renal tubular cells are particularly vulnerable and often sustain the most significant damage during AKI. This raises the question of whether there exists a common pathophysiological mechanism or pathway in renal tubular cells that underlies the development of AKI. We observed that tubular Galectin-3 is significantly up-regulated in four AKI mouse models and its tissue expression shows a positive correlation with tubular injury in human kidneys affected by AKI. The urinary Galectin-3 levels were markedly elevated in a cohort of patients with AKI and these levels correlated with the severity of kidney dysfunction. Based on predictions from bioinformatic analysis and JASPAR database, ChIP-PCR and luciferase-reporter assays demonstrated the direct binding of the transcription factor KLF4 to a specific sequence in the Galectin-3 gene promoter. Furthermore, mice with proximal tubular-specific deletion of KLF4 exhibited reduced kidney injury and inflammation, along with lower Galectin-3 expression in both cisplatin and ischemia-reperfusion-induced AKI. Targeting the KLF4/Galectin-3 axis with Kenpaullone and GB1107 confirmed protective effects against cisplatin-induced cell death and acute kidney injury, respectively. Our study highlights the KLF4/Galectin-3 pathway as a key mediator in the pathogenesis of AKI. Disrupting this signaling pathway may provide a promising therapeutic approach for the treatment of AKI.

Keywords: Galectin-3; KLF4; acute kidney injury; inflammation.; tubular cell death.


Conflict of interest statement

Competing Interests: The authors have declared that no competing interest exists.

Figures

Figure 1
Figure 1
Tubular Lgals3 is identified as a key candidate gene across four models of acute kidney injury and associated with the severity of acute kidney injury in humans. (A) Upset plots showing up-regulated DEGs between PT cell clusters from these four AKI models. The bottom-left barplot showing the total high-interacting genes for each model. (B) GO functional analysis of shared genes from PT cell clusters across these four AKI models. (C) Protein-Protein Interaction network showing the top interacting genes among up-regulated DEGs. (D) Representative immunohistochemical staining images showing the expression of Galectin-3 in kidney tubular cells from patients with AKI. Scale bar = 50 μm. (E) The Galectin-3 score and tubular injury score for patients with acute kidney injury (n = 16). (F) The correlation between the two scores presented in (B) (n = 16). (G) Western blotting showing urinary Galectin-3 protein in healthy subjects and patients with AKI. (H) Graphic presentation shows urinary Galectin-3 protein levels in cohorts of patients with healthy subjects (n = 49) and AKI (n = 26). (I) Graphic presentation shows urinary Galectin-3 protein levels in different etiologies of AKI. 1, healthy subjects; 2, kidney disease; 3, septicopyemia-related AKI; 4, post-cardiac surgery-related AKI. (J-L) Linear regression analysis between urinary Galectin-3 levels and serum creatinine levels (J), BUN levels (K) or estimated glomerular filtration rate (eGFR) (L) in AKI patients and healthy subjects. (M-P) Western blot assays (M and N) and semiquantitative analysis (O and P) showing the abundance of Galectin-3 in the kidneys following cisplatin or ischemia reperfusion-induced AKI, as indicated by the groups (n = 3). (Q) Immunofluorescence co-staining of Galectin-3 with segment-specific tubular markers in cisplatin-challenged kidneys. The following segment-specific tubular markers were used: proximal tubule, lotus tetragonolobus lectin (LTL); distal tubule, peanut agglutinin (PNA). DEGs, differentially expressed genes; IR, ischemia-reperfusion; AA, aristolochic acid; NTS, nephrotoxic serum; Gal3, Galectin-3; AKI, acute kidney injury. IR, ischemia reperfusion. Data are presented as means ± SEM. *p˂0.05 or ***p˂0.001.
Figure 2
Figure 2
Inhibiting Galectin-3 signaling attenuates kidney tubular cell death and acute kidney injury. (A) Western blot showing Galectin-3 expression in HK2 cells treated with cisplatin (25 μg/ml) at different time points as indicated. (B) Galectin-3 expression at protein level in HK2 cells with Galectin-3 siRNA transfection. (C) Western blot for cleaved PARP protein and cleaved caspase 3 in HK2 cells transfected with scramble or Galectin-3 siRNA and followed by cisplatin (25 μg/ml) for 12 hours. (D) Semiquantitative analysis of cleaved PARP and cleaved caspase 3 protein levels from (C) (n = 3). (E) Representative images of TUNEL staining in HK2 cells treated with Galectin-3 or scramble siRNA, as indicated by the groups. Scale bar = 50 μm. (F) Quantification of TUNEL-positive cells per high-powered field in (E) (n = 3). (G) Western blot for cleaved PARP and cleaved caspase 3 protein in HK2 cells treated with GB1107 or vehicle, and followed by cisplatin (25 μg/ml) for 12 hours. (H) Representative flow cytometry plots analyzing GB1107 and vehicle-treated HK2 cells challenged w/o cisplatin, and stained with annexin-FITC and propidium iodide (PI) to identify cellular apoptosis. (I) Summary data quantifying apoptosis among different groups in (H) (n = 3). (J) Representative images of TUNEL staining in HK2 cells treated with GB1107 or vehicle, as indicated by the groups. Scale bar = 50 μm. (K) Quantification of TUNEL-positive cells per high-powered field in (J) (n = 3). (L) Kidney histology from the groups as shown by PAS staining and kidney pathology scores. Scale bar = 100 μm. (M) Serum creatinine levels in mice with different treatment (n = 4). (N-O) Western blots (N) and semiquantification (O) for KIM-1 protein from whole kidney tissue of vehicle and GB1107-treated mice with acute cisplatin nephropathy (n = 4). (P) Representative immunohistochemical staining for KIM-1 protein. Scale bar = 50 μm. (Q) Representative images and quantification analysis of TUNEL staining in kidney sections as indicated groups (n = 4). Scale bar = 50 μm. (R) Representative F4/80 and Ly6G stains of kidney sections from vehicle and GB1107-treated mice with cisplatin challenge. Scale bar = 50 μm. (S) Quantitative analysis for F4/80-positive macrophages and Ly6G-positive neutrophils presented in (R) (n = 4). Data are presented as means ± SEM. *p˂0.05, **p˂0.01, or ***p˂0.001.
Figure 3
Figure 3
The Galectin-3 promoter is bound and transactivated by KLF4. (A) Heatmap analysis of transcription factor activity predicted by the SCENIC package for proximal tubular cells across the indicated groups. (B) The potential promoter sequences of Galectin-3 bound by the transcription factor KLF4, as predicted by the JASPAR database. (C) Chromatin immunoprecipitation-polymerase chain reaction (ChIP-PCR) assays showing PCR amplification of Galectin-3 chromatin corresponding to the region of the promoter (site1: nucleotides -1991 to -2000 and site2: -1443 to -1452 presented in (B)) immunoprecipitated with anti-KLF4 or with control IgG antibody from cisplatin-challenged kidneys. (D) Western blot and graphic presentation showing changes in KLF4 expression in HK2 cells treated with cisplatin (25 μg/ml) or H2O2 (500 mM) at different time points as indicated. (E) Western blot for KLF4 and Galectin-3 protein in HK2 cells transfected with scramble or KLF4 siRNA and followed by cisplatin (25 μg/ml) for 12 hours. One of the three independent experiments with identical results was shown. (F) Representative immunofluorescence staining images for Galectin-3 in HK2 cells transfected with scramble or KLF4 siRNA. Scale bar = 25 μm. (G) KLF4 protein expression in HK2 cells transfected with KLF4-OE plasmid. One of the three independent experiments with identical results was shown. (H) Galectin-3 protein levels in HK2 cells transfected with empty vector control or KLF4-OE plasmid followed by cisplatin treatment. (I) Semiquantitative analysis of Galectin-3 protein from (H) (n = 3). (J) Schematic illustration of Galectin-3 promoter reporter constructs containing the wild-type KLF4 binding sequences (BS WT) and the corresponding mutant sequences (BS Mut) used in luciferase assays. (K) Relative activation of WT and mutant Galectin-3 promoter by KLF4 in 293T cells. The luciferase activity of each group was normalized to that co-transfected with pECMV-NC and pgl4 plasmid (n = 4). Data are presented as means ± SEM. *p˂0.05 or ***p˂0.001.
Figure 4
Figure 4
Blocking the KLF4/Galectin-3 signaling cascade attenuates kidney tubular cell death. (A) Western blot for cleaved PARP and cleaved caspase 3 protein in HK2 cells transfected with scramble or KLF4 siRNA followed by cisplatin exposure. (B) Semiquantitative analysis for cleaved PARP and cleaved caspase 3 protein from (A) (n = 3). (C) Representative flow cytometry plots analyzing KLF4 and scramble siRNA- treated HK2 cells, which were then treated with either vehicle or cisplatin. (D) Summary data quantifying apoptosis among different groups in (C) (n = 3). (E-F) Propidium Iodide (PI) staining assay (E) and quantitative analysis (F) of PI in HK2 cells among groups indicated. Scale bar = 50 μm. (G) Western blot for cleaved PARP and cleaved caspase 3 in HK2 cells with pECMV-KLF4 and/ or Galectin-3 siRNA followed by cisplatin treatment. (H) Semiquantitative analysis for cleaved PARP and cleaved caspase 3 protein levels from (G) (n = 3). (I) KLF4 and Galectin-3 protein expression in HK2 cells pretreated with Kenpaullone and followed by cisplatin (25 μg/ml) for 12 hrs. One of the three independent experiments with identical results was shown. (J) Western blot showing cleaved PARP and cleaved caspase 3 protein levels in HK2 cells pretreated with different concentrations of Kenpaullone followed by cisplatin exposure. (K) Representative flow cytometry plots and quantitative analyses of Kenpaullone- and vehicle-treated HK2 cells, as indicated by the groups (n = 3). (L) PI staining assay and quantitative analysis of PI in HK2 cells among groups indicated (n=3). Scale bar = 50 μm. (M) Western blots showing KLF4 and Galectin-3 protein expression in HK2 cells for the indicated group. One of the three independent experiments with identical results was shown. (N) Western blot analysis showing the levels of cleaved PARP and cleaved caspase 3 proteins in HK2 cells pretreated with various concentrations of APTO-253 before exposure to cisplatin. (O-P) PI staining assay (O) and quantitative analysis (P) of PI in HK2 cells among indicated groups (n=3). Scale bar = 50 μm. Ken, Kenpaullone; PI, Propidium Iodide. Data are presented as means ± SEM. *p˂0.05, **p˂0.01, or *** p˂0.001.
Figure 5
Figure 5
KLF4 protein is induced in tubular cells from patients and mouse models with acute kidney injury, and deletion of KLF4 in proximal tubular cells attenuates cisplatin-induced AKI. (A) Representative immunohistochemical staining images showing the expression of KLF4 in kidney tubular cells from patients with acute kidney injury (AKI). Red arrows indicating the KLF4 positive tubular cells. Scale bar = 50 μm. (B) Representative staining images showing colocalization of KLF4 and Galectin-3 proteins in kidney sections from patients with AKI. White arrow heads indicating double positive tubular cells. Scale bar = 50 μm. (C-D) Western blot assay (C) and semiquantitative analysis (D) showing the abundance of KLF4 protein in the mouse kidneys after cisplatin exposure at day 2 and 3 (n = 3). (E) Linear regression analysis of KLF4 and Galectin-3 expression levels in the kidneys of cisplatin mouse model. (F-G) Western blot assay (F) and semiquantitative analysis (G) showing the expression of KLF4 in the kidneys after IRI at day 1 and 3 (n = 3). (H) Linear regression analysis of KLF4 and Galectin-3 expression levels in the kidneys of IRI mouse model. (I) Strategy for generating mice with kidney proximal tubular-specific deletion of KLF4. (J) Genotyping the mice by PCR analysis of genomic DNA. (K) Representative immunofluorescence staining for KLF4 protein in WT and PKO kidney sections after cisplatin treatment. Scale bar = 50 μm. (L-O) KLF4 and Galectin-3 mRNA (L-M) and protein (N-O) expression levels in kidneys from WT and PKO mice following cisplatin exposure (n = 5). (P) Kidney histology from the groups as shown by PAS staining and kidney pathology scores (n = 5). Scale bar =100 μm. (Q) Serum creatinine and BUN among groups as indicated (n = 5). AKI, acute kidney injury; IRI, ischemia-reperfusion injury. Data are presented as means ± SEM. *p˂0.05, **p˂0.01, or *** p˂0.001.
Figure 6
Figure 6
Tubular KLF4 deficiency attenuates kidney injury, apoptosis and inflammatory response. (A) Principal component analysis of global transcriptomics from WT and PKO kidneys following cisplatin challenge. (B) Heatmap of significant gene expression from WT and PKO kidneys with cisplatin exposure. (C) Renal mRNA expression levels of KIM-1, NGAL and Hnf4a in cisplatin-exposed kidneys from WT and PKO mice (n = 5). (D) Western blots for KIM-1, NGAL and cleaved caspase 3 in kidneys from WT and MKO mice after cisplatin injection at day 3. (E) Semiquantitative determination of protein abundance in (D) (n = 5). (F) Representative kidneys stained with KIM-1 and NGAL protein. Scale bar = 50 μm. (G) Representative images and quantification of TUNEL staining in kidney sections from WT and PKO mice with cisplatin nephropathy (n = 5). Scale bar = 50 μm. (H) Representative immunofluorescence staining for F4/80 and Ly6G in cisplatin-exposed kidneys from different groups as indicated. Scale bar = 50 μm. (I) Quantitative analysis for F4/80-positive macrophages and Ly6G-positive neutrophils in cisplatin-exposed kidneys among groups as indicated (n = 5). (J) The IL6, TNFa, and MCP-1 mRNA expression levels in WT and PKO kidneys following cisplatin treatment (n = 5). Data are presented as means ± SEM. *p˂0.05, **p˂0.01, or *** p˂0.001.
Figure 7
Figure 7
KLF4 deletion in proximal tubular cells ameliorates IRI-induced kidney injury and inflammatory response. (A) Representative images for PAS staining in kidneys among groups as indicated. Scale bar = 100 μm. (B) Kidney pathology scores in (A) (n = 5). (C) Serum creatinine and BUN levels in WT and PKO mice following IRI (n = 5). (D) Renal mRNA levels for KLF4 and Galectin-3 in IRI model (n = 5). (E) Western blot assay and semiquantitative analysis for Galectin-3 protein in IRI kidneys from different groups as indicated (n = 5). (F) Representative immunohistochemical staining for Galectin-3 protein in IRI kidneys among groups as indicated. Scale bar = 50 μm. (G-H) Western blot assay (G) and semiquantitative analysis (H) for KIM-1, NGAL and cleaved caspase 3 protein in IRI kidneys (n = 5). (I) Representative immunohistochemical staining for KIM-1 and NGAL protein in IRI kidneys among groups as indicated. Scale bar = 50 μm. (J-K) Representative images (J) and quantitative analysis (K) of TUNEL staining in the indicated groups (n = 5). Scale bar = 50 μm. (L-M) Representative immunochemical staining (L) and quantitative analysis of F4/80 and Ly6G (M) in IRI-induced kidneys from the indicated groups (n = 5). Scale bar = 50 μm. (N) Renal mRNA expression levels for IL6, TNFa and MCP-1 in IRI kidneys among groups as indicated (n = 5). Data are presented as means ± SEM. *p˂0.05, **p˂0.01, or *** p˂0.001.
Figure 8
Figure 8
Inhibition of KLF4 signaling with Kenpaullone attenuates cisplatin-induced acute kidney injury. (A-B) Western blot assay (A) and semiquantitative analysis (B) for KLF4 and Galectin-3 protein in cisplatin-exposed kidneys among groups as indicated (n = 6). (C) Representative images for PAS staining in cisplatin-exposed kidneys and kidney pathology scores (n = 6). Scale bar = 100 μm. (D) Serum creatinine and BUN levels in groups as indicated (n = 6). (E-F) Western blot assay (E) and semiquantitative analysis (F) for KIM-1, NGAL and cleaved caspase 3 protein in cisplatin-exposed kidneys among groups as indicated (n = 6). (G) Representative images for KIM-1 and NGAL staining in cisplatin-exposed kidneys from vehicle and Kenpaullone-treated mice. Scale bar = 50 μm. (H-I) TUNEL staining (H) and quantification analysis (I) of kidney sections from vehicle and Kenpaullone-treated mice following cisplatin exposure (n = 6). Scale bar = 50 μm. (J-K) Representative immunofluorescence staining (J) and quantitative analysis (K) of F4/80 and Ly6G in cisplatin-treated kidneys from the indicated groups (n = 5). Scale bar = 50 μm. (L) IL-6, TNFa, and MCP-1 mRNA abundance in vehicle and Ken-treated kidneys following cisplatin exposure (n = 6). Data are presented as means ± SEM. *p˂0.05, **p˂0.01, or *** p˂0.001.

References

    1. Kellum JA, Romagnani P, Ashuntantang G, Ronco C, Zarbock A, Anders HJ. Acute kidney injury. Nat Rev Dis Primers. 2021;7:52. - PubMed
    1. Verma S, Kellum JA. Defining Acute Kidney Injury. Crit Care Clin. 2021;37:251–66. - PubMed
    1. Linkermann A, Chen G, Dong G, Kunzendorf U, Krautwald S, Dong Z. Regulated cell death in AKI. J Am Soc Nephrol. 2014;25:2689–701. - PMC - PubMed
    1. Maremonti F, Meyer C, Linkermann A. Mechanisms and Models of Kidney Tubular Necrosis and Nephron Loss. J Am Soc Nephrol. 2022;33:472–86. - PMC - PubMed
    1. Gerhardt LMS, Liu J, Koppitch K, Cippa PE, McMahon AP. Single-nuclear transcriptomics reveals diversity of proximal tubule cell states in a dynamic response to acute kidney injury. Proc Natl Acad Sci U S A. 2021. 118. - PMC - PubMed

LinkOut - more resources