. 2025 Sep 26:16:1624767.
doi: 10.3389/fimmu.2025.1624767. eCollection 2025.

IFNγ regulates MR1 transcription and antigen presentation

Affiliations

IFNγ regulates MR1 transcription and antigen presentation

Megan E Huber et al. Front Immunol. .

Abstract

Introduction: Antigen presentation molecules play key roles in T cell immunity. Multiple complementary pathways are known to regulate classical MHC-I molecules at transcriptional, translational, and post-translational levels. Intracellular trafficking mechanisms dictating post-transcriptional regulation of MR1, the MHC-I-like molecule which restricts MAIT cells, have been an area of focus; however, little is known about MR1 transcriptional regulation. We demonstrate that interferons regulate MR1 transcription.

Methods: Primary human airway epithelial cells (AEC) were treated with recombinant interferons or co-cultured with MAIT cell clones and antigen sources. MR1 expression was analyzed by RT-qPCR and flow cytometry. MAIT cell activity was quantified by ELISPOT.

Results: Treatment of AECs with IFNβ or IFNγ variably increased MR1 transcripts, while only IFNγ significantly increased surface MR1 expression and enhanced antigen presentation to MAIT cells. The MR1 promoter contains binding motifs for interferon regulatory factor 1 (IRF1), an important MHC-I transcription factor. IRF1 knockout reduced IFNγ-stimulated MR1 transcription, surface expression, and antigen presentation. Conversely, knockout of Nod-like Receptor family CARD domain-containing 5 (NLRC5), a critical component of MHC-I transcription, did not significantly impact MR1 expression. These findings were corroborated with IFNγ-treated primary AEC. MAIT cells in co-culture with Streptococcus pneumoniae-infected AEC produced sufficient IFNγ to stimulate MR1 expression.

Conclusion: Our data support a model where IFNγ from activated MAIT cells or another source stimulates IRF1-dependent MR1 expression and antigen presentation, leading to greater MAIT cell activation. A robust MR1-dependent MAIT cell response may be beneficial for early infection responses, allowing minimal antigen stimulus to generate greater proinflammatory activity.

Keywords: IRF1; MAIT (mucosal-associated invariant T) cell; MR1; airway epithelial cell; interferon-gamma.


Conflict of interest statement

The authors declare that the research was conducted in the absence of any commercial or financial relationships that could be construed as a potential conflict of interest.

Figures

Figure 1
Figure 1
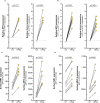
Increased MR1 expression following MAIT cell activation. (A) RT-qPCR of RNA isolated from primary human AECs (n=5) infected with S. pneumoniae (Sp) for one hour and incubated overnight with MAIT cell clone. MR1 expression was calculated relative to HPRT1 expression and uninfected no-MAIT (UI-) controls, paired by individual donor. MR1 (B) mRNA and (C) surface expression of BEAS-2B cells infected with M. smegmatis (Ms) for one hour and incubated overnight with MAIT cell clone. (B) RT-qPCR of MR1 expression was calculated relative to HPRT1 expression and UI- control, paired by experimental replicate. (C) Geometric mean fluorescence intensity (gMFI) of surface MR1 stained with α-MR1 26.5 Ab, paired by experimental replicate. MR1 (D) mRNA and (E) surface expression of BEAS-2B cells treated with 5-OP-RU (left, “5−OP”) or 6-FP (right) for one hour and incubated overnight with MAIT cell clone. (D) RT-qPCR of MR1 expression was calculated relative to HPRT1 expression and UT- control, paired by experimental replicate. (E) gMFI of surface MR1 stained with α-26.5 Ab, paired by experimental replicate. Pairwise statistical analyses are in Supplementary Table 1 . Triangles represent data from primary AEC and circles represent data from BEAS-2B cells. The symbol 'ns' refers to comparisons with p-values < 0.05.
Figure 2
Figure 2
IFNγ induces MR1 expression and function. RT-qPCR of (A) primary human AECs or (B) BEAS-2B cells treated with media control (UT) or recombinant IFNγ for 12 hours. MR1 (left) and HLA-A (right) expression were calculated relative to HPRT1 expression and UT control, paired by individual donor or experimental replicate. Flow cytometry of (C) primary AECs or (D) BEAS-2B cells treated with recombinant IFNγ for 12 hours. gMFI of surface MR1 (left, α-26.5 Ab) and MHC-Ia (right, α-W6/32 Ab) are paired by individual donor or experimental replicate. Pairwise T tests were performed by donor (A, C) or experiment (B, D). Triangles represent data from primary AEC and circles represent data from BEAS-2B cells. Yellow symbols indicate IFNγ treatment.
Figure 3
Figure 3
Transcriptional stimulation of MR1 by IFNγ. (A–D) BEAS-2B:doxMR1-GFP cells were treated with doxycycline, IFNγ, and/or 6-FP overnight. (A) MR1 expression was calculated relative to HPRT1 expression and UT control, paired by experimental replicate. gMFI of (B) MR1-GFP, (C) surface MR1 α-26.5 stain, and (D) surface MHC-Ia α-W6/32 stain. Data are experimental replicates. (E) ELISPOT of BEAS-2B cells treated with filtered M. smegmatis supernatant and MAIT cells. Data points are experimental replicates of no-antigen background-subtracted IFNγ spot-forming units (SFU). Subtracting the background SFU (average 15.6 SFU for UT and 33.7 SFU for IFNγ-treated cells) did not impact statistical significance. (F) Putative transcription factor binding sites were acquired through the Eukaryotic Promoter Database browser using the Search Motif Tool to perform on-the-fly scanning for transcription factor motifs using the FindM tool from the Signal Search Analysis (SSA) Server toolkit (, –104). Highlighted proteins are involved in IRF1- (green) or NLRC5 enhanceosome- (blue) mediated HLA transcription. RT-qPCR of (G) primary human AECs or (H) BEAS-2B cells treated with recombinant IFNγ for 12 hours. IRF1 (left) and NLRC5 (right) expression were calculated relative to HPRT1 expression and UT control, paired by individual donor or experimental replicate. Pairwise T tests were performed by experiment (A–E, H) or donor (G). Diamonds represent data from BEAS-2B:doxMR1-GFP cells, triangles represent data from primary AEC, and circles represent data from BEAS-2B cells. Yellow symbols indicate IFNγ treatment.
Figure 4
Figure 4
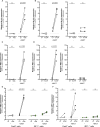
IRF1 mediates IFNγ-induced MR1 transcription. (A) RT-qPCR of BEAS-2B cells treated with IRF1, NLRC5, and/or missense siRNA as labeled for 36 hours, then incubated with IFNγ for 12 hours. MR1 expression was calculated relative to HPRT1 expression and missense UT control, paired by experimental replicate. (B, C) RT-qPCR of Cas9+ or NLRC5-/- clone #1 BEAS-2B cells treated with IRF1 or missense siRNA for 36 hours, then incubated with IFNγ for 12 hours. (B) MR1 and (C) HLA-A expression were calculated relative to HPRT1 expression and Cas9+ or NLRC5-/- clone #1 missense UT controls, paired by experimental replicate. (D) Cells in (B, C) were used as antigen-presenting cells in ELISPOT assay, with filtered M. smegmatis supernatant as the antigen source. Data points are experimental replicates of Cas9+ or NLRC5-/- clone #1 missense control no-antigen background-subtracted IFNγ SFU. Subtracting the background SFU (averages: Cas9+ missense 31.3 SFU, Cas9+ IRF1 KD 18.3 SFU, NLRC5-/- missense 22.0 SFU, NLRC5-/- IRF1 KD 13.9 SFU) did not impact statistical significance. (E, F) RT-qPCR of Cas9+ or IRF1-/- clone #2 BEAS-2B cells treated with IFNγ for 12 hours. (E) MR1 and (F) HLA-A expression were calculated relative to HPRT1 expression and Cas9+ or IRF1-/- clone #2 UT controls, paired by experimental replicate. (G, H) Flow cytometry of Cas9+ or IRF1-/- clone #1 BEAS-2B cells treated with IFNγ for 12 hours. gMFI of (G) surface MR1 (α-26.5 Ab) and (H) MHC-Ia (α-W6/32 Ab) are paired by experimental replicate. Statistical analyses are in Supplementary Table 2 . Yellow symbols indicate IFNγ treatment alone. For visual clarity, silencing of IRF1 (green), NLRC5 (teal), or both (dark blue) are also indicated. In (E-H), light green distinguishes media control IRF1-/- cells from IFNγ-treated IRF1-/- cells (dark green). The symbol 'ns' refers to comparisons with p-values < 0.05.
Figure 5
Figure 5
Reciprocal IFNγ signaling in Sp-infected AEC co-cultured with MAIT cells. (A, B) Flow cytometry of (A) primary human AECs infected with S. pneumoniae (Sp) for one hour and incubated overnight with MAIT cell clone (n=3), or (B) AECs treated with IFNγ for 12 hours (n=3). gMFI of stained pSTAT1 expression is paired by individual donor. (C–F) RT-qPCR of primary human AECs infected with S. pneumoniae (Sp) for one hour and incubated overnight with MAIT cell clone. Expression of (C) β2m, (D) HLA-A (E) IRF1, and (F) NLRC5 were calculated relative to HPRT1 expression and UI- control, paired by individual donor (n=4 (C) or n=5 (D–F) donors). Pairwise statistical analyses are in Supplementary Table 3 . Yellow symbols indicate IFNγ treatment. The symbol 'ns' refers to comparisons with p-values < 0.05.
Figure 6
Figure 6
IFNγ produced by activated MAIT cells drives IRF1-dependent MR1 transcription. (A–D) RT-qPCR of wildtype BEAS-2B cells treated as indicated below. Gene expression was calculated relative to HPRT1 expression and UI- or UT- controls, paired by experiment. (A) HLA-A and (C) IRF1 expression of BEAS-2B cells infected with M. smegmatis (Ms) for one hour and incubated overnight with MAIT cell clone. (B) HLA-A and (D) IRF1 expression of BEAS-2B cells treated with 5-OP-RU (left, “5-OP”) or 6-FP (right) for one hour and incubated overnight with MAIT cell clone. (E, F) RT-qPCR of Cas9+ or IRF1-/- clone #1 BEAS-2B cells (E) infected with M. smegmatis or (F) treated with 5-OP-RU for one hour, then incubated overnight with MAIT cell clone. MR1 expression was calculated relative to HPRT1 expression and Cas9+ or IRF1-/- UT- controls, paired by experimental replicate. Pairwise statistical analyses are in Supplementary Table 4 . In (E, F), green symbols distinguish IRF1-/- cells from Cas9+ cells (gray) as labeled. The symbol 'ns' refers to comparisons with p-values < 0.05.
Figure 7
Figure 7
Interferons stimulate MR1 and MHC-Ia transcription through different pathways. (A) RT-qPCR of wildtype BEAS-2B cells treated with recombinant human cytokines for 12 hours. MR1 expression was calculated relative to HPRT1 expression and UT controls. (B, C, F–H) RT-qPCR of BEAS-2B cells treated with IFNγ or IFNβ for 12 hours. Expression of (B) MR1, (C) HLA-A (F) IRF1, (G) NLRC5, and (H) β2m were calculated relative to HPRT1 and UT control, paired by experiment. (D) Flow cytometry of BEAS-2B cells treated with IFNγ or IFNβ for 12 hours. gMFI of surface MR1 (left, α-26.5 Ab) and MHC-Ia (right, α-W6/32 Ab) are paired by experimental replicate. (E) ELISPOT of BEAS-2B cells treated with IFNγ or IFNβ for 12 hours, infected with a titration of M. smegmatis for one hour, then incubated with MAIT cells overnight. Data points are average SFU of no-antigen background-subtracted IFNγ SFU. Nonlinear regression agonist response curves were computed in GraphPad Prism 10.4.0 and analyzed with extra sum-of-squares F test to compare with UT control. Statistical analyses are in Supplementary Table 5 . Yellow symbols indicate IFNγ treatment, orange symbols indicate IFNβ treatment, and white symbols indicate UT controls. The symbol 'ns' refers to comparisons with p-values < 0.05.
Figure 8
Figure 8
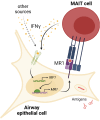
IFNγ signaling induces MR1 expression and MAIT cell activation. IFNγ from MAIT cells or other cellular sources induces IRF1 expression and subsequent increase in MR1 transcription. Increased MR1 expression and antigen presentation enhances MAIT cell responses to antigens from exogenous sources or pathogens like S. pneumoniae or M. smegmatis.

References

    1. Treiner E, Duban L, Bahram S, Radosavljevic M, Wanner V, Tilloy F, et al. Selection of evolutionarily conserved mucosal-associated invariant T cells by MR1. Nature. (2003) 422:164–9. doi: 10.1038/nature01433, PMID: - DOI - PubMed
    1. Gold MC, Cerri S, Smyk-Pearson S, Cansler ME, Vogt TM, Delepine J, et al. Human mucosal associated invariant T cells detect bacterially infected cells. PloS Biol. (2010) 8:e1000407. doi: 10.1371/journal.pbio.1000407, PMID: - DOI - PMC - PubMed
    1. Le Bourhis L, Martin E, Peguillet I, Guihot A, Froux N, Core M, et al. Antimicrobial activity of mucosal-associated invariant T cells. Nat Immunol. (2010) 11:701–8. doi: 10.1038/ni.1890, PMID: - DOI - PubMed
    1. Meermeier EW, Harriff MJ, Karamooz E, Lewinsohn DM. MAIT cells and microbial immunity. Immunol Cell Biol. (2018) 96:607–17. doi: 10.1111/imcb.12022, PMID: - DOI - PMC - PubMed
    1. Hinks TSC, Zhang X-W. MAIT cell activation and functions. Front Immunol. (2020) 0. doi: 10.3389/fimmu.2020.01014, PMID: - DOI - PMC - PubMed

MeSH terms

Substances

LinkOut - more resources