. 2025 Nov 12;16(11):e0268925.
doi: 10.1128/mbio.02689-25. Epub 2025 Oct 13.

Alpha-toxin-elicited CX3CL1 release in Staphylococcus aureus pneumonia impairs bactericidal function of human monocytes

Affiliations

Alpha-toxin-elicited CX3CL1 release in Staphylococcus aureus pneumonia impairs bactericidal function of human monocytes

Srikanth Mairpady Shambat et al. mBio. .

Abstract

Staphylococcus aureus is an important human pathogen causing severe invasive infections. Pathogenesis is attributed to a wide array of virulence factors, including several potent exotoxins such as the pore-forming α-toxin. In this study, we found that patients with S. aureus respiratory tract infections had elevated CX3CL1 levels in airway fluid and plasma. Using human-organotypic lung models, we observed that stimulation of lung epithelium with α-toxin induces an intensified CX3CL1 expression apically in the epithelium as well as the release of CX3CL1. Blocking α-toxin or ADAM10 activity in organotypic lung using an α-toxin-blocking antibody or a specific ADAM10 inhibitor confirmed their role in modulating CX3CL1 cleavage and release. Analyses of CD14+ human monocytes in combination with a CX3CR1 inhibitor revealed that α-toxin-mediated CX3CL1 release induces CX3CL1-dependent chemotaxis. In line with these data, lung tissue from patients with S. aureus respiratory tract infection showed elevated CX3CL1 and CD14 staining as compared with tissue from patients with non-infectious lung diseases. Functional studies of monocytes showed that CX3CL1 released by lung models resulted in upregulated CD83 and downregulated CD86, as well as impaired killing of phagocytosed S. aureus. Furthermore, stimulation of monocytes with soluble CX3CL1 hampered their reactive-oxygen and nitric-oxide production. Taken together our data show that S. aureus triggers the release of lung epithelial CX3CL1, and we identify an immunomodulatory effect of α-toxin involving its cytotoxic and ADAM10-interacting properties, inducing CX3CL1 release leading to impaired monocyte effector function.IMPORTANCEExotoxins are essential virulence factors for the pathobiont S. aureus and contribute toward severe invasive infections such as pneumonia. S. aureus α-toxin is a pore-forming exotoxin that causes host cell lysis and severe lung pathology. We found that α-toxin drives the release of membrane-bound chemokine CX3CL1 by involving ADAM10-mediated proteolytic activity. Furthermore, the release of CX3CL1 modulated immune responses locally, as demonstrated by enhanced monocyte migration and reduced capacity of monocytes to kill ingested bacteria. CX3CL1-induced reduction in bacterial killing coincided with impaired production of reactive oxygen and nitric oxide species. This reveals a novel mechanism in the pathogenesis of S. aureus lung infections involving α-toxin-induced release of CX3CL1, leading to impaired bacterial killing by monocytes.

Keywords: ADAM10; CX3CL1; Staphylococcus aureus; chemotaxis; fractalkine; monocytes; pneumonia; α-toxin.


Conflict of interest statement

The authors declare no conflict of interest.

Figures

Fig 1
Fig 1
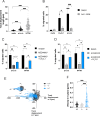
CX3CL1 levels in samples from Staphylococcus aureus-infected patient samples. (A, B) CX3CL1 protein levels in lung airway fluids (bronchioalveolar lavage and tracheal aspirates) from ICU control patients and patients with S. aureus respiratory tract infection (A), and in plasma from healthy volunteers and patients with S. aureus respiratory tract infection (B). The bars show mean ± SEM. (C) Plasma levels of CX3CL1 in S. aureus bacteremia (bloodstream infection) patients and healthy volunteers. Values below the limit of detection (LOD) were set to 0.1103 (LOD/2) and are shown in gray. Statistical significances were calculated using the Mann-Whitney unpaired t-test (A, B) and the Wilcoxon signed-rank test with median value compared with a hypothetical value of 0.156 (i.e., in comparison with LOD) (C).
Fig 2
Fig 2
Alpha-toxin-mediated tissue redistribution and release of CX3CL1. (A) Representative mean intensity projections of immunofluorescence microscopy images of tissue sections from the lung tissue model and human lung tissue. The sections were stained with the nuclear stain 4´,6-diamidino-2-phenylindole, dihydrochloride (DAPI) (blue) in combination with antibodies detecting CX3CL1 (green). The scale bars in images equal 50 µm. (B) Immunofluorescence staining of CX3CL1 (green) and cell nuclei (blue, DAPI) in sectioned lung model stimulated with S. aureus LE2332, NP796, or USA300 bacterial culture supernatants (diluted 1:100), and cell culture media was used as a negative control in the unstimulated models. The scale bars in images equal 100 µm. (C) Measurement of the spatial re-distribution (ratio of apical to basolateral mean fluorescence intensity, MFI) of CX3CL1 in lung tissue stimulated with bacterial culture supernatants (diluted 1:100). (D) CX3CL1 levels in culture supernatants from unstimulated lung tissue model (black bar) or lung tissue models stimulated with LE2332, NP796, or USA300 bacterial culture supernatants (diluted 1:100) (gray). (E) Measurement of the spatial re-distribution (ratio of apical to basolateral MFI) of CX3CL1 in lung models stimulated with various concentrations of α-toxin as indicated. (F) CX3CL1 levels in culture supernatants of unstimulated lung models, or of lung models stimulated with α-toxin suspension (100 ng/mL) or NP796 bacterial culture supernatant (1:100) treated with anti-α-toxin antibodies (200 µg/mL, MEDI4893*) (striped bars). As control (black bar), an isotype-matched antibody was used. (G) CX3CL1 levels in culture supernatants of unstimulated lung model (black bars) or of lung models stimulated with wild-type α-toxin (gray) or the mutated α-toxin H35L (white). ELISA determination of CX3CL1 levels was performed 24 h post-stimulation. All experiments were performed at least three times. In panels D–G, the bars show the mean ± SD of three individual experiments. Statistically significant differences were determined by Kruskal-Wallis with uncorrected Dunn’s test in panels C, D, and G, linear regression analysis in panel E, and ordinary two-way ANOVA with Sidak’s multiple comparison test in panel F.
Fig 3
Fig 3
Alpha toxin-induced CX3CL1 release acts via ADAM10. (A) Schematic drawing of the proposed pathway through which CX3CL1 is released from lung tissue exposed to α-toxin stimulation, and the proposed action of an anti-α-toxin antibody, MEDI4893*, or the ADAM10 inhibitor, GI254023X. (B) CX3CL1 levels in culture supernatants of unstimulated lung models (cell culture media) (black bars), or of lung models pre-treated with 10 µM of ADAM10 inhibitor, GI254023X (gray bars), 2 h post-treatment, the models were stimulated with α-toxin (100 ng/ml) or NP796 bacterial culture supernatant (1:100), or DMSO (GI254023X diluent). ELISA determination of CX3CL1 levels in supernatants of lung models was performed after 24 h of stimulation. (C) Immunofluorescence staining for CX3CL1 (green) and cell nuclei (blue, DAPI) in sectioned lung model stimulated with S. aureus α-toxin (100 ng/mL) or NP796 bacterial culture supernatants (1:100), in the presence of either MEDI4893* (200 µg/mL) or GI254023X (10 µM) or unstimulated models (cell culture media). (D) Measurement of the spatial re-distribution (ratio of apical to basolateral mean fluorescence intensity) of CX3CL1 in lung models stimulated with α-toxin suspensions (100 ng/mL) or NP796 bacterial culture supernatants (1:100), alone (untreated, circle) or treated with anti-α-toxin antibodies (200 µg/mL, MEDI4893*, open square), or the ADAM10 inhibitor, (10 µM, GI254023X, closed square). All experiments were performed at least three times. In panel B, the bars show the mean ± SD of three individual experiments. In panel C, the figure shows data from one representative experiment. In panel D, data are presented as the mean value ± SEM. The scale bars in images equal 100 µm. The statistical significances were calculated by ordinary two-way ANOVA, with Sidak’s multiple comparisons test in panel B and uncorrected Fisher’s LSD in panel D.
Fig 4
Fig 4
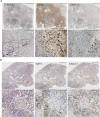
Histological and immunohistochemical qualitative analysis of S. aureus respiratory tract infection. Lung tissue biopsies were stained with Brown-Brenn reagents (gram bacteria), anti-CD14, or anti-CX3CL1 antibodies. (A) Immunohistochemical analysis for gram+ S. aureus (Brown-Brenn, blue), CD14 (brown), and CX3CL1 (brown) of whole biopsy sections (top row) from an S. aureus-infected patient, with higher magnifications (20×, bottom row) of boxed areas. For the S. aureus-stained tissue, a 40× magnification of one selected area in the 20× image is shown (insert). CD14- or CX3CL1-positive cells within this area of consecutive sections are indicated by arrows. The scale bars in images equal 5 mm (top row) or 100 µm (bottom row). (B) Brown-Breen staining and immunohistochemical analysis for CD14 (brown) and CX3CL1 (brown) of whole biopsy sections (top row) from a non-infected fibrosis patient, with higher magnifications (20×, bottom row) of boxed areas. The scale bars in images equal 5 mm (top row) or 100 µm (bottom row).
Fig 5
Fig 5
Monocyte migration in response to α-toxin-induced release of CX3CL1. (A) Live imaging and total displacement determination of monocyte-derived macrophage-like cells in lung tissue models stimulated with α-toxin (100 ng/mL) or NP796 bacterial culture supernatant compared to unstimulated models (cell culture media) as indicated. (B) Migration of human blood monocytes for 2 h in a transwell assay in response to supernatants from unstimulated lung model (cell culture media), lung models stimulated for 24 h with α-toxin (100 ng/mL), or medium supplemented with recombinant CX3CL1 (10 ng/mL), in the absence (DMSO, the diluent of AA-1-2008, black bars) or in the presence of the CX3CL1 receptor antagonist (AA-1-2008, 10 nM, gray bars). Pre-treatment with the CX3CR1 antagonist (AA-1-2008, 10 nM) or DMSO (vehicle) was for 2 h prior to the migration assay. (C) Migration of human blood monocytes for 2 h in a transwell assay in response to supernatants from lung models stimulated with α-toxin (100 ng/mL) or NP796 bacterial culture supernatant (1:100), treated with an isotype control-matched antibody (black bars, 200 µg/mL) or anti-α-toxin antibodies (striped bars, 200 µg/mL, MEDI4893*). Supernatants from anti-α-toxin antibody-treated conditions were supplemented with recombinant CX3CL1 (10 ng/mL, blue bars). (D) Migration of human blood monocytes for 2 h in a transwell assay in response to supernatants from unstimulated lung models (black bars, DMSO GI254023X diluent in cell culture media), or of lung models pre-treated with the ADAM10 inhibitor (gray bars), GI254023X (10 µM) and then stimulated for 24 h with α-toxin (100 ng/mL) or NP796 bacterial culture supernatant (1:100), or medium from GI254023X-treated models supplemented with recombinant CX3CL1 (10 ng/mL, blue bars). (E, F) Live imaging of monocyte-directed migration toward a CX3CL1 gradient in a collagen matrix, total displacement (E) and velocity (F) for 2 h, is shown. In the migration chambers, CX3CL1 (10 ng/mL) was added on both sides (black), excluded (gray), or added on one side (blue). Statistical significances were calculated by ordinary one-way ANOVA, with Tukey’s multiple comparisons test with a single pooled variance in panels A, C, and D, ordinary two-way ANOVA, with Bonferroni’s multiple comparisons test in panel B, and Kruskal-Wallis, with Dunn’s multiple comparisons test in panel F.
Fig 6
Fig 6
CX3CL1 modulates expression of co-stimulatory/inhibitory molecules. (A–D) Monocytes were stimulated or left unstimulated for 24 h and subsequently processed for flow cytometry analysis. MFI for CD83 (A), CD86 (B), PD-L1 (C), and CD80 (D) on HLA-DR+ CD14+ monocytes cultured with supernatants from unstimulated lung models (black bars, cell culture media), or unstimulated lung model supernatants spiked with 10 ng/mL CX3CL1 (blue bars), or lung models stimulated with α-toxin (100 ng/mL) or NP796 bacterial culture supernatant (1:100) (black bars) as indicated. For CX3CL1 stimulation of monocytes, CX3CL1 was added at 10 ng/mL to unstimulated lung model supernatants (blue). Lung model supernatants used to stimulate monocytes were also generated by treating the α-toxin suspension or NP796 supernatant with anti-α-toxin antibodies (striped bars, 200 µg/mL, MEDI4893*), or by treating the lung model with the ADAM10 inhibitor (gray bars, GI254023X, 10 µM) prior to stimulation with either α-toxin or NP796 supernatant. The bars show the mean ± SEM of 8 independent donors, and statistical significances were calculated by the Wilcoxon signed-rank test and the Friedman test, uncorrected Dunn’s test.
Fig 7
Fig 7
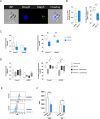
CX3CL1 modulates monocyte function. (A–C) Monocytes stimulated with CX3CL1 (10 ng/mL) or left unstimulated were infected with S. aureus Cowan I-GFP, fixed and stained with Draq5, and analyzed by imaging flow cytometry or CFU assay. (A) Representative images showing monocytes containing bacteria. (B) Image flow quantification of the proportion of Cowan I-GFP+ monocytes after 1 h (left) and after 4 h (right). (C) Percentage phagocytosed Cowan I or LE2332 (1 h, left) and percentage killing of phagocytosed Cowan I or LE2332 (4 h, right) after stimulation with media (white), CX3CL1 (10 ng/mL, blue). The bars show the mean ± SEM of four independent donors. (D) Percentage phagocytosed Cowan I or LE2332 (1 h, left) and percentage killing of phagocytosed Cowan I or LE2332 (4 h, right) after stimulation with lung model supernatants as indicated. The lung model supernatants were obtained by stimulating lung models for 24 h with NP796 bacterial culture supernatant alone (checkered, 1:100), NP796 bacterial culture supernatant treated with MEDI4893* (gray striped, 200 µg/mL), or NP796 bacterial culture supernatant in the presence of GI254023X (gray, 10 µM). (E, F) Monocytes stimulated with CX3CL1 (10 ng/mL) for 18 h or left unstimulated were infected with S. aureus strain LE2332 (MOI 1) and analyzed for ROS and NO production. Representative histograms (E) of ROS and NO production, and representative bar graphs (F) of ROS and NO production by LE2332-infected monocytes. The bar graphs show the mean ± SEM of five independent donors. In panels B–D, data were presented as whisker plots with a box indicating the interquartile range and error bars indicating the highest and lowest values of four independent donors, and statistical significances were calculated by the Mann-Whitney test in panels B and C and the Kruskal-Wallis with uncorrected Dunn’s test in panel D. In panel F, statistical significances were calculated by Wilcoxon matched-pairs signed-rank test.

References

    1. Dinges MM, Orwin PM, Schlievert PM. 2000. Exotoxins of Staphylococcus aureus. Clin Microbiol Rev 13:16–34, doi: 10.1128/CMR.13.1.16 - DOI - PMC - PubMed
    1. Foster TJ. 2005. Immune evasion by staphylococci. Nat Rev Microbiol 3:948–958. doi: 10.1038/nrmicro1289 - DOI - PubMed
    1. Voyich JM, Vuong C, DeWald M, Nygaard TK, Kocianova S, Griffith S, Jones J, Iverson C, Sturdevant DE, Braughton KR, Whitney AR, Otto M, DeLeo FR. 2009. The SaeR/S gene regulatory system is essential for innate immune evasion by Staphylococcus aureus. J Infect Dis 199:1698–1706. doi: 10.1086/598967 - DOI - PMC - PubMed
    1. Bhakdi S, Tranum-Jensen J. 1991. Alpha-toxin of Staphylococcus aureus. Microbiol Rev 55:733–751. doi: 10.1128/mr.55.4.733-751.1991 - DOI - PMC - PubMed
    1. Bubeck Wardenburg J, Patel RJ, Schneewind O. 2007. Surface proteins and exotoxins are required for the pathogenesis of Staphylococcus aureus pneumonia. Infect Immun 75:1040–1044. doi: 10.1128/IAI.01313-06 - DOI - PMC - PubMed

MeSH terms

LinkOut - more resources