. 2025 Dec 1;224(12):e202312109.
doi: 10.1083/jcb.202312109. Epub 2025 Oct 13.

Tepsin and AP4 mediate transport from the trans-Golgi to the plant-like vacuole in toxoplasma

Affiliations

Tepsin and AP4 mediate transport from the trans-Golgi to the plant-like vacuole in toxoplasma

Janessa Grech et al. J Cell Biol. .

Abstract

Apicomplexan parasites are obligate intracellular pathogens possessing unique organelles but lacking several components of the membrane trafficking machinery conserved in other eukaryotes. While some of these components have been lost during evolution, others remain undetectable by standard bioinformatics approaches. Using a conditional splitCas9 system in Toxoplasma gondii, we previously identified TGGT1_301410, a hypothetical gene conserved among apicomplexans, as a potential trafficking factor. Here, we show that TGGT1_301410 is a distant ortholog of T. gondii tepsin (TgTEP), localized to the trans-Golgi and functioning as an accessory protein of the adaptor protein complex 4 (AP4). We demonstrate that AP4-TgTEP is essential for the actin-dependent transport of vesicles to the plant-like vacuole (PLVAC) and Golgi organization. Notably, our findings reveal that, unlike in metazoans, the AP4 complex in T. gondii utilizes clathrin as a coat protein, a mechanism more closely aligned with that of plants. These results underscore a conserved yet functionally adapted vesicular transport system in Apicomplexa.


Conflict of interest statement

Disclosures: The authors declare no competing interests exist.

Figures
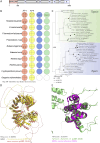
Figure 1.
Figure 1.
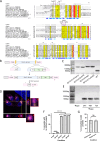
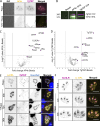
Evolution and structural assessment of adaptor complexes and accessory components in Apicomplexa. (A) Schematic of TgTEP protein architecture showing an ENTH_VHS domain and disordered regions (marked “D”), with no additional annotated motifs. Generated using DOG 2.0 (Ren et al., 2009). (B) Coulson plot representing the result of HMMer searches in 10 selected apicomplexans. Colored areas represent presence of protein homologs, white sections represent absence or unidentified, and numbers represent multiple paralogs identified. Respective proteins are annotated along with the binomial names of the species. (C) Phylogenetic analysis of epsin and tepsin using human protein sequences as references. aBayes represents Bayesian posterior probability calculations; NP represents nonparametric bootstrap support values. Clade in green represents tepsin; clade in blue represents epsin. (D) 3D superimposition of predicted AP4-ε structures of human (red) and T. gondii (yellow), TM-score, and pLDDT are provided. (E) 3D superimposition of the predicted TgTEP (green) with the crystal of human tepsin ENTH domain (magenta), TM-score, and pLDDT are provided.
Figure S1.
Figure S1.
ESPript 3.0 output of multiple sequence alignment (MSA) is shown with secondary structure of the crystal structure of AP4-interacting ENTH domain. (A) Secondary structure element shown as squiggly lines represents the seven alpha helices of the crystal structure. Below the MSA is the bar representing solvent accessibility; blue, white, and teal colors represent accessible, buried, and intermediate residues of the protein. Residues highlighted in yellow demonstrate the alignment residue similarity; red highlight demonstrates identity. Purple arrows represent functional residues responsible for tepsin interaction with AP4. tENTH: Toxoplasma ENTH domain. (B) Tagging and floxing strategy for TgTEP (TGGT1_301410). (C) Genotyping of the WT (524 bp) parasite strain as well as parasite strains obtained wherein TGGT1_301410 is endogenously tagged with mCherry (1290 bp), SYFP2 (1299 bp), Halo (1529 bp), and TurboID (1557 bp). Primer design corresponds to the red arrows in panel B. (D) Orthogonal views of the merged image in Fig. 2 C show that despite TgTEP and SortLR come in very close proximity, they do not always colocalize. (E) Knockout of tagged TGGT1_301410 results in a band size of 514 bp. The floxed, endogenously tagged protein (-Rapa) could not be amplified due to its huge size. Primer design corresponds to black arrows in B. (F) The clone expressing TgTEP-mCherry was used to quantify loss of protein via IFA. 95% of parasite vacuoles lost the protein by 48 hpi. Data are presented as mean ± SD. One-way ANOVA with Tukey’s multiple comparison test was performed, with P values being represented as follows: ns ≥ 0.05; ** = 0.001–0.01; **** ≤0.0001. (G) Invasion assays were done, using parasites that were grown in the presence of 50 nM rapamycin or DMSO for a period of 48 h, after which these were manually released and allowed to invade fresh HFFs. All assays were done thrice, with a minimum of 100 parasites/vacuoles quantified per condition per replicate. All data are plotted as mean ± SD. Unpaired two-tailed Student’s t test was where P = 0.8193. hpi, h post-induction. Source data are available for this figure: SourceData FS1.
Figure 2.
Figure 2.
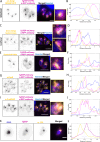
TgTEP localizes close to the trans-Golgi. Colocalization analysis of TgTEP (in magenta) with various markers (in yellow) done in triplicate with a minimum of 100 parasites observed per replicate. Profile plots were taken across the respective lines. (A and B) Parasites expressing GRASP-RFP (a cis-Golgi marker) show no clear overlap with TgTEP. (C and D) Parasites expressing SortLR-Halo (a marker for the trans-Golgi) show a partial overlap with TgTEP. (E–J) Similarly, colocalization analysis with other postGolgi markers, such as parasites expressing syntaxin-6-Halo (E and F), stained with α-DrpB (G and H) or α-ProM2AP (I and J) show only a partial overlap with TgTEP. (K and L) Colocalization analysis on extracellular parasites between TgTEP and the PLVAC marker CPL shows no significant overlap. Scale bars: 5 µm (2 µm for CPL). Prior to obtaining the profile plots, images were converted to 8 bit for intensity normalization.
Figure 3.
Figure 3.
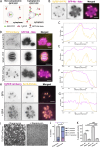
TgTEP localizes in the cytoplasm and is essential for parasite survival. (A) Scheme of strategy to determine the localization of TgTEP. A GFP-nanobody fused to a Halo-tag was stably expressed within the parasites by replacing the UPRT locus. This nanobody has no target sequence and therefore localizes within the cytoplasm. In cases where no GFP, YFP, or SYFP2 are accessible within the cytoplasm, no colocalization with the nanobody occurs, and the nanobody signal remains diffuse within the cytoplasm (left panel). In cases where GFP, YFP, or SYFP2 are present within the cytoplasm, the nanobody binds to the fluorescent tag, resulting in colocalization (right panel). (B and C)TgTEP-SYFP2 colocalizes with the cytosolic nanobody. (D–G) FRM-2-SYFP2 (positive control), SAG1-YFP, and TgTEP-mCherry (negative controls) confirm selective binding of the GFP-nanobody. (H) BFA disrupts Golgi, redistributing both TgTEP and SortLR in all cases (100%). All scale bars are 5 μm. (I) 7-day plaque assays were done with LoxP-TgTEP parasites in the presence of 50 nM rapamycin or vehicle control (DMSO). Knockout (KO) mutants (+rapamycin) did not form plaques in the host cell monolayer. Scale bars are 1.5 mm. (J) Replication assays were performed after the induction of parasites with 50 nM rapamycin or DMSO for a period of 48 h. The number of knockout parasites per vacuole was significantly lower than that of WT parasites. (K) Egress assays were done in the presence of 50 nM rapamycin or DMSO (−/+ Rapa). Egress was either allowed to occur naturally or was induced using calcium ionophore A23187 (−/+ CI). The percentage of successfully egressed parasites was significantly lower for the knockout mutants. All assays were done thrice, with a minimum of 100 parasites/vacuoles quantified per condition per replicate. All data are plotted as mean ± SD. One-way ANOVA with Tukey’s multiple comparison test were performed. Color-coded P values in J represent the vacuoles compared. P values are represented as follows: ns ≥ 0.05; * = 0.01 - 0.05; ** = 0.001 – 0.01; *** = 0.0001 – 0.001; **** ≤0.0001.
Figure 4.
Figure 4.
Knockout of TgTEP results in trans-Golgi fragmentation. (A) The cis-Golgi marked with GRASP-RFP (in yellow) is unaffected upon knockout of TgTEP (shown in magenta). This was observed in 100% of cases. (B) TEM images demonstrate that in non-induced parasites (-Rapa), Golgi stacks are organized adjacent to the nucleus. At 48- and 72-h after treatment with 50 nM rapamycin (+Rapa), TgTEP knockout results in the appearance of large electron-lucent vesicular structures and disruption of Golgi integrity. Scale bars: 1 μm. (C) Upon knockout of TgTEP (in magenta), the trans-Golgi, labelled by endogenously tagged SortLR with Halo-tag (in yellow), was seen to fragment. (D) Quantification confirms significantly increased trans-Golgi fragmentation at 48 h post-induction (hpi) with rapamycin in TgTEP-KO compared with controls. (E) The compartment marked by DrpB (yellow) is seen to fragment upon TgTEP (in magenta) knockout. (F) Quantifications showed that in knockout parasites, the fragmentation of the post-Golgi compartment marked by DrpB was significantly higher than that in WT parasites after 48 hpi with rapamycin. (G) Syntaxin-6 distribution is similarly disrupted following TgTEP loss. (H) Knockout of TgTEP (in magenta) was not seen to affect the ELC labelled with anti-ProM2AP antibodies (in yellow). All immunofluorescence assays were done three times, with a minimum of 100 parasite vacuoles quantified per condition per replicate. Data are presented as mean ± SD. One-way ANOVA followed by Tukey’s multiple comparison test were done, with P values being represented as follows: ns ≥ 0.05; ** = 0.001–0.01; **** ≤0.0001. All scale bars are 5 μm. KO, knockout.
Figure S2.
Figure S2.
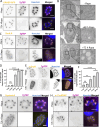
Knockout of TgTEP does not affect the localization of micronemes, rhoptries, dense granules, IMC, or apicoplast but causes mitochondrial fragmentation. (A–E) IFAs using antibodies against (A) micronemes (Mic8), (B) rhoptries (Rop2,4), (C) dense granules (Gra1), (D) IMC (IMC1), and (E) apicoplast (G2-Trx) (all in yellow) showed that knockout of TgTEP (tagged with mCherry, shown in magenta) has no effect on their localization. Immunofluorescence assays were done in triplicate, with a minimum number of 100 vacuoles per replicate observed. The nuclei were labelled with Hoechst. (F) Knockout of TgTEP (in magenta) results in the fragmentation of the mitochondria (marked using the anti-TOM40 antibodies in yellow). All scale bars are 5 μm. (G) Quantification of mitochondrial fragmentation at different time points after induction of TgTEP knockout. Data are presented as mean ± SD. One-way ANOVA with Tukey’s multiple comparison test was done, with P values being represented as follows: ns ≥ 0.05; * = 0.01–0.05; **** ≤0.0001. (H) The percentage of parasitophorous vacuoles showing altered CPL localization was significantly higher in knockout mutants after 48 h post-induction (hpi) with 50 nM rapamycin. The assay was done three times, with a minimum of 100 vacuoles quantified per condition per replicate. The data are plotted as mean ± SD. Besides, CPL signal intensity quantifications confirmed an accumulation of CPL, this being significantly higher in knockout parasites after 48 h post-induction (hpi) with rapamycin. The assay was done three times, with the intensities of a minimum of 15 vacuoles quantified per condition per replicate. The data are plotted as mean ± SD, with the dots representing the value for each data point. For both assays, one-way ANOVA with Tukey’s multiple comparison test was done. The P values are represented as follows: ns ≥ 0.05; ** = 0.001–0.01; **** ≤0.0001. (I) CPL signal, which typically appears more confined to a few structures in extracellular WT parasites, also appeared to accumulate in extracellular TgTEP-knockout parasites. Scale bars are 3 μm.
Figure 5.
Figure 5.
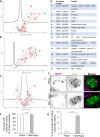
TgTEP and TgAP4 interact in clathrin-mediated transport to the PLVAC. (A) Colocalization experiments demonstrate that Halo-tagged AP-4ε (in yellow) colocalizes with mCherry-tagged TgTEP (in magenta). AP-4ε localization at the Golgi disappears in absence of TgTEP. All scale bars are 5 μm. (B) Western blot analysis of reciprocal co-IP assays confirms the physical interaction between TgTEP–GFP and AP4ε–HA. Beads alone, anti-GFP, and anti-HA–conjugated pull-downs are shown. Full blots are provided in Source Data. (C and D) Mass spectrometry of co-IP elutes reveals a significant enrichment of AP4 complex subunits and clathrin in both TgTEP and AP4ε pull-downs, displayed as volcano plots. Notably, CRT, a PLVAC transporter, is also enriched, supporting a role for this complex in PLVAC-directed trafficking. (E) CPL is found in small cytoplasmic vesicles in intracellular parasites and typically shows a diffuse localization. Depletion of TgTEP (in magenta) resulted in an accumulation of CPL (in yellow). This accumulation was seen as early as 48 h after induction, and fragmentation occurred at 72 h after induction of TgTEP knockout. Scale bars are 5 μm. (F) Colocalization of CPL (in yellow) with SortLR-Halo (in magenta) upon deletion of TgTEP demonstrates that CPL accumulation occurs in the trans-Golgi prior to its fragmentation. Scale bars are 5 μm. Source data are available for this figure: SourceData F5.
Figure 6.
Figure 6.
TgTEP and TgAP4ε are essential for PLVAC trafficking and parasite survival. (A) Plaque assay of WT and loxP-AP4ε-HA parasites shows a drastic diminution of plaques in parasites induced with 50 nM of rapamycin. (B) Quantification of plaque area. One-way ANOVA with Tukey’s multiple comparison test was done. The P values are represented as follows: ns ≥ 0.05; * = 0.01; **** ≤0.0001. (C) Immunofluorescence imaging shows CPL (magenta), a PLVAC marker, accumulates in AP4ε-KO parasites (AP4ε shown in green) from 48 h after induction, mirroring the phenotype observed in TgTEP-KO. Scale bar: 5 μm. (D) Temporal distribution of phenotype appearances in TgTEP knockout parasites showing that disruption of CPL trafficking precedes Golgi fragmentation. Mitochondria collapse occurred significantly later. (E)TgTEP was tagged with TurboID at the C terminus to carry out proximity-based biotinylation and find interaction partners via the addition of 150 μM biotin. Immunofluorescence assays using fluorescently conjugated streptavidin show the localization of these biotinylated proteins (in magenta). Biotinylation for different lengths of time show different intensities and localizations of biotinylated proteins. Naturally occurring biotinylated proteins within the apicoplast are also labelled with the fluorescently conjugated streptavidin. The apicoplast was co-labelled with antibodies against G2-Trx (in yellow). All images are normalized. Scale bars are 5 μm. (F) All proteins identified at the 30-min time point were also identified at the 6-h time point. Proteins of high interest identified are listed and included those typically associated with the Golgi and postGolgi compartments (in blue), actin-binding proteins (in pink), proteins associated with parasite’s endocytic micropore (in green), and an uncharacterized AP-4 subunit (in orange). KO, knockout.
Figure S3.
Figure S3.
Biotinylated proteins identified by mass spectrometry. (A and B) show the difference in protein hits between WT (WT30) and TgTEP-TurboID (S30) sample following 30 min of biotinylation, whereas (B) shows the difference between WT (WT6) and TurboID (S6) sample following 6 h of biotinylation. (C) shows the total number of proteins enriched during the 6-h experiment (S6) vs the 30-min experiment (S30) after normalization of protein abundance. Proteins of particular interest in panels A–C are numerated and listed in the table in D. (E) Halo-tagged SAG1 was labelled with a cell non-permeable dye for an hour, then parasites were allowed to replicate for a further 24 h to observe endocytosis of SAG1-containing vesicles. After addition of rapamycin, endocytosis was not affected. (F) Quantification of endocytosis events is similar in non-induced parasites (-Rapa) or induced parasites (+48 Rapa). (G) Quantification of vesicles demonstrates accumulation and enlargement upon deletion of TgTEP. Scale bars are 5 μm. Data are plotted as mean ± SD. Unpaired two-tailed Student’s t test was calculated for F and G, where P < 0.0001.
Figure 7.
Figure 7.
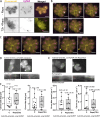
TgTEP interacts with the actomyosin system. (A) Immunofluorescence images suggested that knockout of TgTEP (in magenta) resulted in a change in actin filament formation (chromobody-emerald in yellow). In WT parasites, the filaments primarily localize at the actin polymerization center near the Golgi body and connect the parasites within the parasitophorous vacuole at the basal end. Upon knockout of TgTEP, less actin filaments were observed at the actin nucleation center around the Golgi, and the filaments connecting the parasites appeared more prominent. (B and C) In live movies (see Video 1), TgTEP (in magenta) was seen colocalizing and moving along actin filaments (marked with the Cb-emerald in yellow). (B) Still images taken from the live movies wherein the white arrow indicates vesicles that are moving along actin filaments close to the actin nucleation center. (C) The yellow arrow points toward vesicles, which are moving along actin filaments along the periphery of the parasites. (D and E) Representative kymographs and analyzed tracks of inducible TgTEP KO in actin-chromobody emerald-LoxP-TgTEP cell lines. Top panels show the ROI path (green) for kymograph analysis. Bottom panels show kymograph with tracks (green and red) chosen for extracting quantitative data. (D and E) The left panel shows an untreated parasitophorous vacuole, while (E) shows an example of a vacuole 72 h after induction with rapamycin. (F) Actin kinetics estimated as a measurement of actin chromobody displacement support no changes in actin kinetics as a result of abrogation of TgTEP. KO, knockout.
Figure 8.
Figure 8.
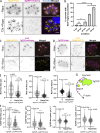
TgTEP knockout alters MyoF dynamics but has no effect on FRM2. (A) In WT parasites, MyoF is seen to localize around the periphery of the cells and near the actin nucleation center proximal to the Golgi body. Upon knockout of TgTEP (in magenta; + 72 h Rapa), MyoF (in yellow) was seen to form aggregates within the parasites. This was observed in both live as well as fixed parasites. MyoF and TgTEP images were recorded with STED, while the nuclei (labelled with Hoechst) were taken with the confocal setting. Scale bars are 3 μm. (B) The number of parasitophorous vacuoles with altered MyoF localization was seen to be significantly higher compared with WT parasites starting at 48 h post-induction (hpi) with 50 nM rapamycin. The assay was done thrice, with a minimum of 100 vacuoles quantified per condition per replicate. Data are plotted as mean ± SD. One-way ANOVA with Tukey’s multiple comparison test was applied, with P values being represented as follows: ns ≥ 0.05; * = 0.01–0.05; **** ≤0.0001. (C) FRM2, typical localizing at the Golgi region, seemed unaffected upon knockout of TgTEP. (D) Knockout of FRM2 has no influence on the location of TgTEP at the TGN. (E) KO of TgTEP (72 hpi) hampered transport kinetics of MyoF. Estimated displacement (total and net displacement) of MyoF in the PV was significantly affected. (F) Inducible FRM2 KO cell line showed that TgTEP-dependent traffic was affected 72 hpi with rapamycin, suggesting a role of actin regulating the distribution of TgTEP. (G) Proposed model: TgTEP vesicles depend on actin polymerization for directional trafficking, mediated by MyoF. Upon TgTEP deletion, MyoF accumulates in immobile aggregates, whereas FRM2 positioning remains unchanged. All scale bars except in A are 5 μm. KO, knockout.
Figure 9.
Figure 9.
Homology searches of adaptor complexes AP1 and AP4 components, epsin, and tepsin across 53 pan-eukaryotic species with statistical assessment for co-occurrence of AP4 and tepsin. (A) Coulson plot representing result of HMMer search based comparative genomics conducted across selected eukaryotic species with their eukaryotic classification. Circles or sections filled with color demonstrate presence of protein homologs; unfilled sections demonstrate loss. Color only represents single paralog identification; numbers represent multiple paralogs. Key is provided for the abbreviated species binomial names. (B) Independence chi-square test calculation matrices for presence of absence of variables: AP4 and tepsin. First matrix shows actual values of different variations of presence or absence of both the variables, second matrix shows the expected frequencies for the four variations, and third matrix represents the chi-square points, along with the calculated χ2 and P value. (C) Graphical representation of the AP4 and tepsin co-occurrence test is provided with the calculated χ2 and P value, along with the blocks of graph representing all the variations of occurrence.
Figure 10.
Figure 10.
Model for TgTEP-dependent vesicular transport. The schematic illustrates the role of TgTEP in coordinating vesicle transport from the TGN to the PLVAC. TgTEP, in complex with the AP4, binds to vesicles that bud from the TGN. These vesicles are transported along actin filaments in a MyoF-dependent manner (orange arrow). A subset of these TgTEP/AP4-positive vesicles may fuse with endocytic vesicles originating from the micropore, contributing to the delivery of internalized material to the PLVAC (red arrow). Upon TgTEP deletion, vesicle trafficking is disrupted, leading to the accumulation of vesicles at the TGN, fragmentation of the trans-Golgi, and impaired delivery of PLVAC cargo. As a result, the PLVAC fails to properly digest or recycle material, which may lead to secondary defects such as mitochondrial fragmentation. Other secretory pathways (e.g., to micronemes, rhoptries, or dense granules) remain functional and are shown as unaffected (gray arrows).

References

    1. Alvarez-Jarreta, J., Amos B., Aurrecoechea C., Bah S., Barba M., Barreto A., Basenko E.Y., Belnap R., Blevins A., Böhme U., et al. 2024. VEuPathDB: The eukaryotic pathogen, vector and host bioinformatics resource center in 2023. Nucleic Acids Res. 52:D808–D816. 10.1093/nar/gkad1003 - DOI - PMC - PubMed
    1. Amos, B., Aurrecoechea C., Barba M., Barreto A., Basenko E.Y., Bażant W., Belnap R., Blevins A.S., Böhme U., Brestelli J., et al. 2022. VEuPathDB: The eukaryotic pathogen, vector and host bioinformatics resource center. Nucleic Acids Res. 50:D898–d911. 10.1093/nar/gkab929 - DOI - PMC - PubMed
    1. Andenmatten, N., Egarter S., Jackson A.J., Jullien N., Herman J.P., and Meissner M.. 2013. Conditional genome engineering in Toxoplasma gondii uncovers alternative invasion mechanisms. Nat. Methods. 10:125–127. 10.1038/nmeth.2301 - DOI - PMC - PubMed
    1. Archuleta, T.L., Frazier M.N., Monken A.E., Kendall A.K., Harp J., McCoy A.J., Creanza N., and Jackson L.P.. 2017. Structure and evolution of ENTH and VHS/ENTH-like domains in tepsin. Traffic (Copenhagen, Denmark). 18:590–603. 10.1111/tra.12499 - DOI - PMC - PubMed
    1. Barlow, L.D., Maciejowski W., More K., Terry K., Vargová R., Záhonová K., and Dacks J.B.. 2023. Comparative genomics for evolutionary cell biology using AMOEBAE: Understanding the Golgi and beyond. Methods Mol. Biol. 2557:431–452. 10.1007/978-1-0716-2639-9_26 - DOI - PubMed

MeSH terms

LinkOut - more resources