. 2025 Oct 13;11(1):457.
doi: 10.1038/s41420-025-02763-8.

Apomorphine is a novel necroptosis inhibitor targeting mixed lineage kinase domain-like protein oligomerization

Affiliations

Apomorphine is a novel necroptosis inhibitor targeting mixed lineage kinase domain-like protein oligomerization

Myeonggil Han et al. Cell Death Discov. .

Abstract

Necroptosis, a form of programmed cell death, has emerged as a promising therapeutic target. Although several RIPK1 inhibitors have demonstrated favorable safety profiles in clinical trials, clinical translation of necroptosis-targeted therapies remains limited by modest efficacy, limited specificity, and species-specific activity of compounds such as necrosulfonamide (NSA). To resolve these challenges, this study identified a potential necroptosis inhibitor from a clinical drug library. Apomorphine (APO), a non-addictive morphine derivative used to treat Parkinson's disease, was found to inhibit necroptosis by sterically blocking key residues involved in mixed lineage kinase domain-like protein (MLKL) activation and oligomerization, as confirmed by nuclear magnetic resonance analysis. APO is redox sensitive and prone to auto-oxidation. The oxidized form of APO (Ox-APO) showed stronger binding to MLKL than the reduced form of APO (Re-APO), as demonstrated by surface plasmon resonance analysis. Ox-APO significantly ameliorated tissue damage in two murine necroptosis models: dextran sulfate sodium (DSS)-induced colitis and acetaminophen (APAP)-induced liver injury. Collectively, these data highlight the therapeutic potential of APO as a necroptosis-specific inhibitor in necroptosis-related diseases in both humans and mice.


Conflict of interest statement

Competing interests: The authors declare no competing interests. Ethical approval and consent to participate: All methods were performed in accordance with relevant guidelines and regulations. C57BL/6 and BALB/c mice were used following procedures approved by the Institutional Animal Care and Use Committee (IACUC) of the Yonsei Laboratory Animal Research Center (YLARC, 2018-0024). MLKL–/– C57BL/6 mice were used following procedures approved by the IACUC of the Laboratory Animal Research Center (LARC) of Ajou University Medical Center (2023-0053). No human participants were involved in this study; therefore, informed consent was not required.

Figures
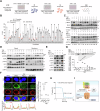
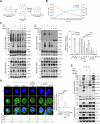
Fig. 1
Fig. 1. Screening and selection of necroptosis signaling inhibitor molecules.
A, B Workflow of necroptosis inhibitor screening. THP-1-HMGB1-LuciaTM cells (1 × 105 cells/well) were treated with a combination of TBZ (a necroptosis inducer) and each chemical compound for 8 h to harvest the supernatants. Seventy-two compounds that inhibited luciferase activity by <20% compared to TBZ-treated cells were selected from the pool of 2150 compounds and then tested for PI uptake after TBZ and each compound treatment to select 18 compounds. The luciferase assay was repeated at least twice for selection. Eighteen compounds (*) were those that inhibited PI uptake signal <30% of TBZ-treated cells (red dotted line), and known necroptosis inhibitors (S10, S16, S17, and S31). Results are the mean of three independent experiments. NEC-1 is used as a positive control inhibitor. C, D THP-1 cells were treated with TBZ and each selected candidate for 8 h. Whole cell lysates (WCLs) were prepared for Western blot analysis to observe phosphorylated (p-) MLKL. The p-MLKL/MLKL ratio was quantified relative to TBZ-treated cells. Data represent the mean of three independent experiments. The quantification graph from three replicates is shown in Fig. S1A (C). THP-1 cells were separated into cytosol and membrane fractions, and p-MLKL and p-RIP1 were determined using MLKL and RIP1, respectively. LDH and LAMP1 were used as cytosolic and membrane markers, respectively. A representative blot is provided, and the quantification graph from three independent experiments is shown in Fig. S1B (D). E THP-1 cells were treated with TBZ and 20 μM S62, which is APO, for 8 h. WCLs were prepared to detect p-MLKL, RIP3, and RIP1 for immunoblotting. A representative experiment of three replicates is shown. F THP-1 cells were treated with TBZ and APO for 8 h and stained with DAPI, MLKL, and the membrane marker CD36 for confocal microscopy. Co-localization of MLKL with CD36 was analyzed to assess its membrane translocation. In the intensity graph, green indicates MLKL and red indicates CD36. The signal intensity of MLKL fluorescence from the plasma membrane to the cytosol was measured using FluoView FV1000 software. Mean ± SEM (n > 100). **p < 0.001, one-way ANOVA. Data represent three independent experiments with mean ± SEM (n = 3). G Inhibition of TBZ-mediated HMGB1 release by APO. THP-1 cells were treated with TBZ and different concentrations of APO for 8 h. HMGB1 levels were determined in the cell culture supernatant. Results are the mean of three independent experiments. *p < 0.05, **p < 0.001, ns not significant, one-way ANOVA. H THP-1 cells were treated with APO, and PI uptake was measured to estimate the IC50. The percentage of PI uptake level was compared with that of TBZ-treated cells. Results are the mean of three independent experiments. I Hypothetical mechanism of APO.
Fig. 2
Fig. 2. Effect of redox-sensitive APO on MLKL oligomerization.
A Chemical structure of APO. APO undergoes auto-oxidation to form the oxidized form (Ox-APO), while the addition of DTT preserves the reduced form (Re-APO). The red highlights indicate the sites where APO loses hydrogen and electrons during the oxidation process. B Real-time 1D 1H NMR spectra showing the degree of oxidation of APO. APO was dissolved from its powdered form in DPBS and incubated at 25 °C for 36 h. Real-time 1D 1H NMR spectra were measured at a 2 h intervals after filtration through a 0.2 μm syringe filter to remove precipitates. The graph shows the formation of Ox-APO over time as Re-APO is oxidized in aqueous solution. C MLKL oligomerization is inhibited by APO. THP-1 cells were treated with TBZ and Re-APO or Ox-APO for 8 h. Western blot analysis of WCLs was performed under non-reducing and reducing conditions using the indicated antibodies. Percentage changes of p-MLKL oligomer band relative to GAPDH were shown. The p value for MLKL oligomer band intensity was calculated based on the average intensity of the tetramer and octamer bands. Octa octamer, Tetra tetramer, Mono monomer. Mean ± SEM (n = 3). **p < 0.001, ns not significant, one-way ANOVA. D THP-1 cells were treated with TBZ and Ox-APO or Re-APO for 8 h and then stained with DAPI and MLKL for confocal microscopy. In the intensity graph, green indicates MLKL. The signal intensity of MLKL fluorescence from the plasma membrane to the cytosol was measured using FluoView FV1000 software. Mean ± SEM (n > 100). **p < 0.01, ***p < 0.001, one-way ANOVA. E J774A.1 mouse monocytic cells were treated with TBZ and 20 μM Re-APO or Ox-APO for 8 h. Western blot analysis of WCLs was performed under non-reducing and reducing conditions using the indicated antibodies.
Fig. 3
Fig. 3. SPR analysis of APO to MLKL.
AE Human and mouse wild-type MLKL (Wt-hMLKL and -mMLKL), N-terminal (Nt) and C-terminal (Ct)-hMLKL, Nt-mMLKL proteins were immobilized on CM5 chips. Re-APO and Ox-APO analytes were added at concentrations of 0 μg/mL, 12.5 μg/mL, 25 μg/mL, 50 μg/mL, 100 μg/mL, and 200 μg/mL. KD values were measured using BIAevaluation software.
Fig. 4
Fig. 4. Structural analysis of the interaction between APO and Nt-hMLKL.
A NMR analysis of Ox-APO binding to Nt-hMLKL. APO was pre-incubated for 0, 2, 4, 8, 12, and 24 h at 25 °C for auto-oxidation, and the NMR 1H-15N HSQC spectrum of Nt-hMLKL in the presence of APO (red) is superimposed on that of unbound Nt-hMLKL (blue). The labeled amino acid residues indicate an increase in CSPs due to their interaction with Ox-APO. B CSPs (histogram, left y-axis) and intensity ratio values (dot, right y-axis) of backbone amides of Nt-hMLKL in response to Ox-APO are plotted. α1 to α6 indicate the helices of Nt-hMLKL. I/I0 the intensity ratio, I the intensity of Nt-hMLKL with APO, I0 the intensity of unliganded Nt-hMLKL; green bar, amino acid residues overlapped by CSP peaks that are completely or barely visible. C CSP mapping onto the 3D conformer (PDB ID code 6ZPR). The UCSF Chimera program displays conformers in 3D as ribbon or sphere surfaces and colors amino acid residues from purple (highest) to white (lowest) based on the height of the CSP peaks. Residues not visible by NMR are colored black. D Comparison of the APO binding site of Nt-hMLKL (green; PDB ID code 6ZPR). Ox-APO (yellow) is shown as sticks. Key interacting residues are shown as sticks (covalent bond between Cys86 and Ox-APO; π–π stacking between Phe148 and Ox-APO core). E, F SPR analysis. Nt-hMLKLC86A and Nt-hMLKLF148A (E), and Nt-hMLKLC86A/L89A/D94A and Nt-hMLKLR145A/R146A/F148A/M150A (F) were immobilized on CM5 chips, and Ox-APO at concentrations of 0, 12.5, 25, 50, 100, and 200 μg/mL was flowed through to observe binding.
Fig. 5
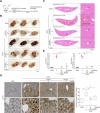
Fig. 5. APO ameliorates IBD in the DSS-induced mouse colitis model.
A Experimental design of DSS-induced colitis in mice. C57BL/6 mice were given a 2.5% DSS in the drinking water for 8 days. Re-APO or Ox-APO was administered intraperitoneally daily for 7 days starting on day 0. On day 8, the mice were sacrificed, and the colon tissues were collected. B Mouse colon tissues were collected, and the effect of Re-APO or Ox-APO on histopathology was evaluated by H&E and PAS staining. C Histological scores of each group were evaluated. Mean ± SD (n = 5). *p < 0.05, ***p < 0.001, one-way ANOVA. D DAI of colitis was measured as mean ± SD (n = 5). **p < 0.01, ***p < 0.001, t-test. E Colon length was measured. Representative images of the colon (left) and colon length (right). Mean ± SD (n = 5). *p < 0.05, **p < 0.01, ***p < 0.001, one-way ANOVA.
Fig. 6
Fig. 6. APO protects against liver injury in an APAP-induced mouse model.
A BALB/c male mice (6–8-weeks-old) received an i.p. injection of 400–500 mg/kg APAP in the presence or absence of APO after a 12 h fasting period. Livers were perfused and harvested 24 h after the injection. B Gross morphology of liver tissues (n = 3 per group) after 500 mg/kg APAP injection to induce severe liver injury. C H&E staining of liver tissues after APAP injection. The necrotic area was quantified using ImageJ by measuring the unstained regions and calculating their proportion relative to the total tissue area. The boxed images are magnifications. D Membrane-localized p-MLKL was assessed by IHC staining of paraffin-embedded liver sections. The boxed images are magnifications. Quantification of membrane-localized p-MLKL signal intensity was performed on over 100 cells per group using Zen imaging software (Zeiss), with normalization to cytosolic p-MLKL intensity. Data are presented as mean ± SD. *p < 0.001; one-way ANOVA. E Serum AST and ALT levels were evaluated to assess liver injury after APAP injection. Mean ± SD (n = 3). *p < 0.001, ns not significant, one-way ANOVA.

References

    1. Degterev A, Huang Z, Boyce M, Li Y, Jagtap P, Mizushima N, et al. Chemical inhibitor of nonapoptotic cell death with therapeutic potential for ischemic brain injury. Nat Chem Biol. 2005;1:112–9. - PubMed
    1. Kim YS, Morgan MJ, Choksi S, Liu ZG. TNF-induced activation of the Nox1 NADPH oxidase and its role in the induction of necrotic cell death. Mol Cell. 2007;26:675–87. - PubMed
    1. Zelic M, Kelliher MA. Analyzing necroptosis using an RIPK1 kinase inactive mouse model of TNF shock. Methods Mol Biol. 2018;1857:125–34. - PMC - PubMed
    1. Sun L, Wang H, Wang Z, He S, Chen S, Liao D, et al. Mixed lineage kinase domain-like protein mediates necrosis signaling downstream of RIP3 kinase. Cell. 2012;148:213–27. - PubMed
    1. Huang D, Zheng X, Wang ZA, Chen X, He WT, Zhang Y, et al. The MLKL channel in necroptosis is an octamer formed by tetramers in a dyadic process. Mol Cell Biol. 2017;37:e00497-16. - PMC - PubMed

LinkOut - more resources