. 2025 Oct 13;16(1):9075.
doi: 10.1038/s41467-025-64144-0.

ALKBH8-mediated codon-specific translation promotes colorectal tumorigenesis

Affiliations

ALKBH8-mediated codon-specific translation promotes colorectal tumorigenesis

Yu Qian et al. Nat Commun. .

Abstract

Reprogramming gene expression at the translational level drives intestinal tumorigenesis. Codon decoding during translation elongation relies on tRNA modifications, while their pathological relevance in colorectal cancer remains to be elucidated. Here, we show that AlkB homolog 8 (ALKBH8), a uridine 34 (U34) tRNA methyltransferase, is a direct target of Wnt/β-catenin and is upregulated in colorectal cancer. Genetic ablation of ALKBH8 inhibits the development of intestinal tumors in Apcmin/+, azoxymethane/dextran sulfate sodium (AOM/DSS), and xenograft models. Loss of ALKBH8 induces ribosome pausing at adenine-ending codons, impairing the translation elongation of mRNAs enriched with these codons. Specifically, ALKBH8 regulates the translation of KRAS proto-oncogene in a codon-dependent manner. Rescue experiments demonstrate that the methyltransferase activity of ALKBH8 is required for its translation-promoting function. Together, our findings reveal ALKBH8-dependent mRNA translation as a critical mediator of intestinal tumorigenesis, underscoring its potential as a promising target for colorectal cancer therapy.


Conflict of interest statement

Competing interests: The authors declare no competing interests.

Figures

Fig. 1
Fig. 1. β-Catenin promotes the expression of ALKBH8.
a Venn diagram demonstrating the overlap of down-regulated genes in β-catenin knockdown cells and β-catenin-binding targets. b ChIP-qPCR analysis of β-catenin binding to ALKBH8 gene promoter region, with β-actin (ACTB) gene serving as the control. ChIP analysis was performed with antibodies against β-catenin or control IgG and analyzed by qPCR. Mean ± SEM, 3 biological replicates, two-sided t-test. c, d The mRNA level (c) and protein level (d) of ALKBH8 in HCT116 cells with or without β-catenin knockdown. Mean ± SEM, 3 biological replicates, two-sided t-test. The samples derive from the same experiment but different gels for ALKBH8, c-myc, and GAPDH, and another for β-catenin were processed in parallel. e, f The mRNA level (e) and protein level (f) of ALKBH8 in RKO cells with or without β-catenin overexpression. Mean ± SEM, 3 biological replicates, two-sided t-test. The samples derive from the same experiment, but different gels for β-catenin and c-myc, another for ALKBH8 and GAPDH, were processed in parallel. g Schematic of luciferase reporters with wild-type ALKBH8 promoter or TCF4 binding site mutated construct. h Dual-Luciferase assay using constructs with either the wild-type ALKBH8 promoter or a mutated TCF4 binding site in HCT116 cells with or without β-catenin overexpression. Mean ± SEM, 3 biological replicates, two-sided t-test. i ALKBH8 protein expression in intestinal tissue from Apcmin/+ mice. N, normal tissue. T, tumor tissue. j ALKBH8 protein expression in intestinal tissue from AOM/DSS-treated mice. N, normal tissue. T, tumor tissue. The samples derive from the same experiment but different gels for ALKBH8, another for Actin were processed in parallel. k The mRNA level of ALKBH8 in colorectal cancer tissues and adjacent normal tissues from TCGA database (normal = 42, CRC = 286). Mean ± SD, two-sided t-test. l Two-sided Pearson’s correlation analysis of ALKBH8 mRNA and CTNNB1 mRNA in colorectal cancer tissues from TCGA database, 268 samples. Source data are provided as a Source Data file.
Fig. 2
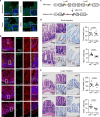
Fig. 2. Depletion of Alkbh8 reduces intestinal epithelium proliferation.
a Immunofluorescence staining of ALKBH8 in duodenum, jejunum, ileum, and colon sections of mice. b Immunofluorescence co-staining of ALKBH8 with DCLK1, MUC2, Ki67, LYZ, and LGR5 in duodenum sections of mice. c Schematic of Alkbh8 conditional knockout (Alkbh8cKO) mouse. d The representative jejunum from wild-type (Alkbh8CTL) and Alkbh8cKO mice. Left: hematoxylin and eosin staining (H&E); middle: BrdU staining; right: quantification of crypt height and BrdU+ cells. e The representative colon from wild-type (Alkbh8CTL) and Alkbh8cKO mice. Left: hematoxylin and eosin staining (H&E); middle: BrdU staining; right: quantification of crypt height and BrdU+ cells. Mean ± SEM, 6 biological replicates, two-sided t-test. Source data are provided as a Source Data file.
Fig. 3
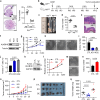
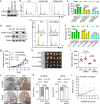
Fig. 3. ALKBH8 promotes intestinal tumorigenesis.
a H&E staining of small intestines from 24-week-old Apcmin/+;Alkbh8CTL and Apcmin/+;Alkbh8cKO mice. The black arrows indicate the tumors. Statistical analysis of tumor number is shown on the right panel. Mean ± SEM, 6 mice for each group, two-sided t-test. b Workflow of the AOM/DSS-induced cancer model. c Colons from Alkbh8CTL and Alkbh8cKO mice on day 84 of AOM/DSS induction. d Colon tumor number from (c). Mean ± SEM, 6 mice for each group, two-sided t-test. e H&E staining of colons from Alkbh8CTL and Alkbh8cKO mice after AOM/DSS induction. f Immunoblotting analysis of ALKBH8 (A8) expression in CTL and A8-KO HCT116 cells. g The proliferation assay of CTL and A8-KO HCT116 cells. Cell number at day 4 was statistically analyzed. Mean ± SEM, 3 biological replicates, one-way ANOVA with Dunnett’s multiple comparisons test. h Colony formation assay of CTL and A8-KO HCT116 cells. i The statistical analysis of colony numbers in (h). Mean ± SEM, 3 biological replicates, one-way ANOVA with Dunnett’s multiple comparisons test. j Apoptosis analysis of CTL, A8-KO HCT116 cells. Mean ± SEM, 3 biological replicates, one-way ANOVA with Dunnett’s multiple comparisons test. k Immunoblotting analysis of ALKBH8 expression in CTL and A8-OE HCT116 cells. l The proliferation assay of CTL and A8-OE HCT116 cells. Cell number at day 4 was statistically analyzed. Mean ± SEM, 3 biological replicates, two-sided t-test. m Colony formation assay of CTL and A8-OE HCT116 cells. n The statistical analysis of colony numbers in (m). Mean ± SEM, 3 biological replicates, two-sided t-test. o The volume of xenograft tumors from mice implanted with CTL, A8-KO, or A8-OE cells. Mean ± SEM, 6 mice for each group, one-way ANOVA with Dunnett’s multiple comparisons test. p The images of xenograft tumors from mice implanted with CTL, A8-KO, or A8-OE cells. q The statistical analysis of tumor weight in (p). Mean ± SEM, 6 mice for each group, one-way ANOVA with Dunnett’s multiple comparisons test. Source data are provided as a Source Data file.
Fig. 4
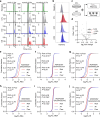
Fig. 4. Transcriptome-wide identification of ALKBH8-regulated mRNAs.
a Mass spectrometry analysis of cm5U, mcm5U and mcm5s2U levels in tRNAs from CTL, A8-KO and A8-OE HCT116 cells, 3 biological replicates. b OP-Puro labeling of global translation levels in CTL and A8-KO HCT116 cells, 3 biological replicates. c Schematic of RNA-seq (up) and Ribo-seq (bottom) experiments. d Fold change of ribosome density in A site for each codon after ALKBH8 depletion. 2 independent sequencing experiments, P values were calculated using Wald test with Benjamini–Hochberg correction. e–g Cumulative distributions of ribosome density change (e), mRNA change (f), and relative ribosome density change (TE) (g) for codon-rich, codon-poor, and total transcripts. All the genes were divided into codon-rich genes (top 20%) and codon-poor genes (bottom 20%) based on the content of 5A-ending codons (including AAA, CAA, GAA, AGA, and GGA). 2 independent sequencing experiments, Two-sided Mann–Whitney test. h–j Cumulative distributions of ribosome density change (h), mRNA change (i), and relative ribosome density change (j) for codon-rich, codon-poor, and total transcripts. All the genes were divided into codon-rich genes (top 20%) and codon-poor genes (bottom 20%) based on the content of 5G-ending codons (including AAG, CAG, GAG, AGG, and GGG). 2 independent sequencing experiments, Two-sided Mann–Whitney test. Source data are provided as a Source Data file.
Fig. 5
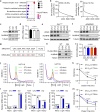
Fig. 5. ALKBH8 regulates the translation elongation of KRAS.
a KEGG analysis of genes enriched with A-ending codons and exhibiting increased ribosome density following ALKBH8 knockout. 2 independent sequencing experiments, P values were calculated using DAVID (modified Fisher’s exact test with Benjamini–Hochberg correction). b Transcriptomic distribution of the percentage of 5A-ending codons. The percentage of A-ending codons for KRAS and Kras gene was highlighted. c Immunoblot analysis of KRAS expression in CTL and A8-KO HCT116 cells. d KRAS mRNA levels in control, A8-KO HCT116 cells. Mean ± SEM, 3 biological replicates, one-way ANOVA with Tukey’s multiple comparisons test. e Immunoblot analysis of 3 pairs of tumors from Apcmin/+;Alkbh8CTL and Apcmin/+;Alkbh8cKO mice. f Immunoblot analysis of 3 pairs of tumors from Alkbh8CTL and Alkbh8cKO mice of AOM/DSS induction. g Schematic of synonymous mutation of KRAS gene. h The expression of wild-type KRAS gene and its synonymous mutant in CTL and A8-KO cells. i The mRNA level of KRAS in CTL and A8-KO HCT116 cells. Mean ± SEM, 3 biological replicates, one-way ANOVA with Tukey’s multiple comparisons test. j Ribosomal elongation speed was measured using harringtonine chase. Polysome profiles of CTL cells or A8-KO cells treated with harringtonine (2 ug/mL) for indicated times. Monosome (80S) and polysomes were highlighted and the P/M ratio change was quantified in the right panel. k The polysome dissociation halftime in (g) was calculated. Mean ± SEM, 3 biological replicates, two-sided t-test. l The distributions of KRAS/ACTB mRNAs in the polysome fractions of (g). Mean ± SEM, 3 biological replicates, two-sided t-test. m The dissociation halftime of KRAS mRNA in (i) was calculated. Mean ± SEM, 3 biological replicates, two-sided t-test. Source data are provided as a Source Data file.
Fig. 6
Fig. 6. The methyltransferase domain is required for ALKBH8-regulated translation.
a Schematic of ALKBH8 domain structure and its key amino acids. b Mass spectrometry analysis of cm5U, mcm5U, and mcm5s2U levels in tRNAs from CTL and A8-KO HCT116 cells, 3 biological replicates. c OP-Puro labeling analysis of global translation levels, 3 biological replicates. d Immunoblot analysis of CTL cells, A8-KO cells reconstituted with wild-type A8 or MT-mutant. e Proliferation analysis of CTL cells, A8-KO cells reconstituted with wild-type A8 or MT-mutant. Mean ± SEM, 3 biological replicates, one-way ANOVA with Tukey’s multiple comparisons test. f Colony formation assay of CTL cells, A8-KO cells reconstituted with wild-type A8 or MT-mutant. Mean ± SEM, 3 biological replicates, one-way ANOVA with Tukey’s multiple comparisons test. Source data are provided as a Source Data file.
Fig. 7
Fig. 7. KRAS contributes to ALKBH8-mediated CRC progression.
a Immunoblotting analysis of control cells and KRAS knockdown cells. b Cell cycle analysis of control cells and KRAS knockdown cells. c Statistical analysis of cell cycle distribution in (b). Mean ± SEM, 3 biological replicates, one-way ANOVA with Dunnett’s multiple comparisons test. d Immunoblotting analysis of control cells and A8-KO cells with or without KRAS overexpression. e Cell cycle analysis of control cells and A8-KO cells with or without KRAS overexpression. f Statistical analysis of cell cycle distribution in (e). Mean ± SEM, 3 biological replicates, one-way ANOVA with Tukey’s multiple comparisons test. g The volume of xenograft tumors from mice implanted with control cells and A8-KO cells with or without KRAS expression. Mean ± SEM. 5 mice for each group, one-way ANOVA with Tukey’s multiple comparisons test. h The images of xenograft tumors from mice implanted with control cells and A8-KO cells with or without KRAS expression. i The analysis of tumor weight in (h). Mean ± SEM, 5 mice for each group, one-way ANOVA with Tukey’s multiple comparisons test. j Representative immunohistochemistry (IHC) images depicting KRAS protein level and ALKBH8 protein level in adjacent normal tissue and CRC tissue in a CRC tissue array. k IHC scoring of ALKBH8 and KRAS in para-cancer tissues and CRC tissues. Distribution of low (+) and high (++) levels of ALKBH8 and KRAS protein expression in para-cancer tissues and CRC tissues. Two-sided Chi-square test; n = 80 for each group. l Two-sided Pearson’s correlation showed relationship of ALKBH8 and KRAS by using H-score. n = 80. Source data are provided as a Source Data file.

References

    1. Lao, V. V. & Grady, W. M. Epigenetics and colorectal cancer. Nat. Rev. Gastroenterol. Hepatol.8, 686–700 (2011). - PMC - PubMed
    1. Fearon, E. R. Molecular genetics of colorectal cancer. Annu Rev. Pathol.6, 479–507 (2011). - PubMed
    1. Fearon, E. R. & Vogelstein, B. A genetic model for colorectal tumorigenesis. Cell61, 759–767 (1990). - PubMed
    1. Nusse, R. & Clevers, H. Wnt/beta-catenin signaling, disease, and emerging therapeutic modalities. Cell169, 985–999 (2017). - PubMed
    1. Morin, P. J., Kinzler, K. W. & Sparks, A. B. beta-catenin mutations: Insights into the APC Pathway and the power of genetics. Cancer Res76, 5587–5589 (2016). - PubMed

MeSH terms

LinkOut - more resources