. 2025 Oct 13;16(1):9070.
doi: 10.1038/s41467-025-64136-0.

Integrated single-cell multiomic profiling of caudate nucleus suggests key mechanisms in alcohol use disorder

Affiliations

Integrated single-cell multiomic profiling of caudate nucleus suggests key mechanisms in alcohol use disorder

Nicholas C Green et al. Nat Commun. .

Abstract

Alcohol use disorder (AUD) induces complex transcriptional and regulatory changes across multiple brain regions including the caudate nucleus, which remains understudied. Using paired single-nucleus RNA-seq and ATAC-seq on caudate samples from 143 human postmortem brains, including 74 with AUD, we identified 17 distinct cell types. A significant portion of the alcohol-related differences in gene expression were accompanied by a corresponding difference in chromatin accessibility within the gene. We observed transcriptional differences in medium spiny neurons that impact RNA metabolism and immune response pathways. A small cluster of D1/D2 hybrid neurons showed AUD-induced differences distinct from the D1 and D2 types, suggesting a unique role in AUD. Those with AUD had a higher proportion of microglia in an inflammatory state; astrocytes entered a reactive state partially regulated by JUND. Oligodendrocyte dysregulation was driven in part by OLIG2 activity and increased TGF-β1 signaling from microglia and astrocytes. We also observed increased microglia-astrocyte communication via the IL-1β pathway. These findings provide valuable insights into the genetic and cellular mechanisms in the caudate related to AUD. They also demonstrate the broader utility of large-scale multiomic studies in uncovering complex gene regulation across diverse cell types, which has implications beyond the substance use field.


Conflict of interest statement

Competing interests: The authors declare no competing interests.

Figures
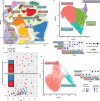
Fig. 1
Fig. 1. Cell type landscape of the caudate nucleus in alcohol use disorder.
a UMAP plot of the 1,307,323 nuclei profiled in the snRNA-seq and sn-Multiome assays; visualization shown is based on the snRNA-seq profile. Nuclei are labeled by cell type and cell type proportion among all snRNA-seq cells. Cell types: cholinergic neurons (Ach), astrocytes (Astro), cholecystokinin-expressing interneurons (CCK), calretinin-expressing interneurons (CR), D1-type medium spiny neurons (D1), D2-type medium spiny neuron (D2), medium spiny neurons expressing both D1 and D2 receptors (D1/D2), endothelial cells (Endo), ependymal cells (Epend), fast-spiking interneurons (FS), glutamatergic neurons (Glut), low-threshold-spiking interneurons (LTS), non-microglial macrophages (Macro), microglia (Micro), oligodendrocytes (Oligo), oligodendrocyte progenitor cells (OPCs), and vascular smooth muscle cells (vSMCs). Light green-highlighted clusters denote non-neuronal cells, light orange-highlighted clusters denote medium spiny neurons, and light blue-highlighted clusters denote other neuronal populations. b Left, UMAP of 45,682 microglial cells, colored by subcluster. Right, dot plot of expression and prevalence of representative marker genes for each microglial subcluster. “Average Expression” denotes the mean log-normalized expression level across cells in each subcluster, scaled for each gene, and “Percent Expressed” denotes the percentage of cells in which the log-normalized expression of the gene is greater than zero. c Scatter plot showing, for each of 129 individuals with at least 50 microglia cells, the percentage of inflammatory microglia and the subject’s age (red, AUD; blue, no AUD). Bars on the left quantify the ratio of individuals with AUD to those without AUD among those with ≥50% (above the black line) or <50% (below) of microglia in the inflammatory state. d Left, UMAP of 130,129 astrocyte cells, colored by subcluster. Right, dot plot of expression and prevalence of representative marker genes for each subcluster. “Average Expression” and “Percent Expressed” are as described in (b). Source data are provided as a Source data file.
Fig. 2
Fig. 2. Characterization of AUD-associated differences in gene expression in the caudate nucleus.
a Bar plot showing number of genes differentially expressed in individuals with AUD for the eight cell types which have over 100 differentially expressed genes (FDR < 0.05). Red and blue indicate positively and negatively differentially expressed genes (DEGs), respectively. DESeq2 was used for DEG testing. See Supplementary Data 7 for number of individuals tested for each cell type. Cell types: astrocytes (Astro), D1-type medium spiny neurons (D1), D2-type medium spiny neuron (D2), medium spiny neurons expressing both D1 and D2 receptors (D1/D2), endothelial cells (Endo), ependymal cells (Epend), fast-spiking interneurons (FS), microglia (Micro), oligodendrocytes (Oligo), oligodendrocyte progenitor cells (OPCs). b Total RNA-seq reads across individuals plotted against number of DEGs (FDR < 0.05) for each cell type, c Heatmap of biological pathways from the Reactome database enriched in brain samples from individuals with AUD in each cell type. The top 100 enriched pathways based on the smallest Benjamini–Hochberg adjusted p values (FDR) across all cell types are shown and were hierarchically clustered based on the number of genes shared between the pathways. Heatmap cell color indicates FDR. Asterisk indicates negative enrichment score; all other pathways have positive enrichment scores. The pathways are divided into 25 clusters, which are manually labeled with a brief summary of the pathways making up that cluster. Clusters are colored with a combination of colors corresponding to all cell types significantly enriched (FDR < 0.05) for at least 50% of the pathways in the cluster. Source data are provided as a Source data file.
Fig. 3
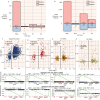
Fig. 3. Characterization of AUD-associated differences in chromatin accessibility in the caudate nucleus.
a Number of differentially accessible regions identified in oligodendrocytes, astrocytes, D1, and D2-type MSNs; red and blue indicate positively and negatively differentially accessible regions (FDR < 0.05), respectively, and lighter and darker coloring indicate regions in promoter regions of genes, respectively. Promoter regions are defined as a 1 kilobase region on either side of the transcription start side of each gene. See Supplementary Data 12 for the number of individuals tested for each cell type. b As a, for enhancer regions (>1 kilobase from the transcription start site of a gene). cf Top, scatter plot of ATAC peak log fold changes and RNA-seq log fold changes for genes with at least one differentially accessible region in the promoter region (within one kilobase from the transcription start site) (FDR < 0.2, see below for number of genes plotted for each cell type). Genes are colored based on whether the gene is also differentially expressed (FDR < 0.2); Bottom, GSEA enrichment plot of enrichment of the same ATAC-significant genes, split into two sets based on positive or negative effect size, across genes ranked by differential expression fold change. Normalized enrichment score (NES) and Benjamini–Hochberg adjusted p value (FDR) for each GSEA test are shown. c oligodendrocytes, 4314 genes plotted; d astrocytes, 336 genes plotted; e D1 MSNs, 529 genes plotted; f D2 MSNs, 290 genes plotted. Source data are provided as a Source data file.
Fig. 4
Fig. 4. Cell type-specific gene regulatory networks associated with AUD.
a Boxplot of the log of chromVAR motif activity score for the JUND motif in astrocytes for samples from 105 individuals with and without AUD (49 AUD, 56 no AUD). Center of boxes denote median log Enrichment Score, with box boundaries denoting Q1 (25th percentile) and Q3 (75th Percentile). Bottom whisker edge denotes Q1−1.5 × Interquartile Range (IQR), and top whisker denotes Q3 + 1.5 × IQR. Here and following, “log” denotes natural logarithm. P value is reported from a Wilcoxon Signed-Rank Test for the difference in JUND motif activity between individuals with and without AUD. b UMAP of 13,911 astrocyte cells from individuals without AUD (left plot) and with AUD (right plot). Dot color indicates the enrichment of the JUND motif (red) and the log-normalized C3 expression (green). Yellow indicates high expression of C3 and high JUND motif enrichment. c Boxplot of the log of C3 expression in astrocytes for samples from 143 individuals with and without AUD (74 AUD, 69 no AUD). Box center, edges, and whiskers are defined as in (a). P value is reported from a Wilcoxon Signed-Rank Test, as in (a). d Left, UMAP of 325,593 oligodendrocyte cells, clustered and annotated into three subclusters using graph-based clustering. Right, dot plot of MBP and OLIG2 expression and prevalence for each oligodendrocyte subcluster. “Average Expression” denotes the mean log-normalized expression level across cells in each subcluster, scaled for each gene, and “Percent Expressed” denotes the percentage of cells in which the log-normalized expression of the gene is greater than zero. e Boxplot of the log of chromVAR motif activity score for the OLIG2 motif in oligodendrocytes for samples from 124 individuals with and without AUD (64 AUD, 60 no AUD). Box center, edges, and whiskers are defined as in (a). The p value is reported from a Wilcoxon Signed-Rank Test, as in (a). f Circos plot showing the top five ligand-receptor interactions (determined by scaled ligand activity score from MultiNicheNet) between astrocytes, oligodendrocytes, and microglia. Colors denote cell types, and arrows denote direction of signaling. Source data are provided as a Source data file.

Update of

References

    1. World Health Organization. Global Status Report on Alcohol and Health 2018 (World Health Organization, 2018).
    1. American Psychiatric Association. Diagnostic and Statistical Manual of Mental Disorders: DSM-5™ 5th edn (American Psychiatric Publishing, a division of American Psychiatric Association, 2013).
    1. Reilly, M. T., Noronha, A., Goldman, D. & Koob, G. F. Genetic studies of alcohol dependence in the context of the addiction cycle. Neuropharmacology122, 3–21 (2017). - PMC - PubMed
    1. Saunders, G. R. B. et al. Genetic diversity fuels gene discovery for tobacco and alcohol use. Nature612, 720–724 (2022). - PMC - PubMed
    1. Clarke, T. K. et al. Genome-wide association study of alcohol consumption and genetic overlap with other health-related traits in UK Biobank (N=112 117). Mol. Psychiatry22, 1376–1384 (2017). - PMC - PubMed

MeSH terms

Substances

LinkOut - more resources