. 2025 Oct 13;16(1):9091.
doi: 10.1038/s41467-025-64980-0.

Capturing disease severity in LIS1-lissencephaly reveals proteostasis dysregulation in patient-derived forebrain organoids

Affiliations

Capturing disease severity in LIS1-lissencephaly reveals proteostasis dysregulation in patient-derived forebrain organoids

Lea Zillich et al. Nat Commun. .

Abstract

LIS1-lissencephaly is a neurodevelopmental disorder marked by reduced cortical folding and severe neurological impairment. Although all cases result from heterozygous mutations in the LIS1 gene, patients present a broad spectrum of severity. Here, we use patient-derived forebrain organoids representing mild, moderate, and severe LIS1-lissencephaly to uncover mechanisms underlying this variability. We show that LIS1 protein levels vary across patient lines and partly correlate with clinical severity, indicating mutation-specific effects on protein function. Integrated morphological, transcriptomic, and proteomic analyses reveal progressive changes in neural progenitor homeostasis and neurogenesis that scale with severity. Mechanistically, microtubule destabilization disrupts cell-cell junctions and impairs WNT signaling, and defects in protein homeostasis, causing stress from misfolded proteins, emerge as key severity-linked pathways. Pharmacological inhibition of mTORC1 partially rescues these defects. Our findings demonstrate that patient-derived organoids can model disease severity, enabling mechanistic dissection and guiding targeted strategies in neurodevelopmental disorders.


Conflict of interest statement

Competing interests: O. F. has affiliated with Springer Nature following the completion of her work on this project. The other authors have no relevant financial or non-financial interests to disclose.

Figures
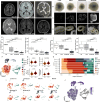
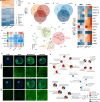
Fig. 1
Fig. 1. Morphological and cellular characterization of LIS1 patient-derived organoids across severity grades.
A Representative MRI scans from patients with mild, moderate, and severe LIS1-lissencephaly reveal increasing cortical malformation severity. Mild cases show posterior pachygyria with preserved frontal regions; moderate cases display posterior pachygyria extending into the parietal and occipital lobes with mild frontal involvement; severe cases exhibit diffuse pachygyria or near-complete agyria, mainly in posterior regions. B Brightfield images of control and patient-derived organoids at day 20 demonstrate morphological changes correlating with severity. C Light sheet microscopy of whole-tissue cleared day 20 organoids, immunostained for β-III tubulin (TUBB3), shows differences in neuronal organization across severity grades. D Hoechst staining of ventricular zone (VZ) structures at day 20 reveals progressive disruption in VZ architecture with increasing disease severity. Yellow dotted lines delineate VZ boundaries. E Quantification of VZ structural parameters demonstrates significant differences among groups. Individual data points represent mean values from independent differentiations (control n = 7, mild n = 8, moderate n = 6, severe n = 16; ≥3 organoids and 8 VZs per differentiation; total VZs: control = 71, mild = 70, moderate = 63, severe = 222). Boxplots show median, 25th/75th percentiles, and 1.5 interquartile range whiskers, Kruskal–Wallis test with Wilcoxon post hoc correction. F UMAP dimensionality reduction and clustering identifies 10 distinct cell populations in day 23 ± 3 organoids: neuroepithelial cells (NE), cycling progenitors (CyP), radial glia (RG), intermediate progenitors (IP), transitory RG (t-RG), dorsal forebrain neurons (dFB-N), ventral forebrain neurons (vFB-N), midbrain neurons (MB-N), interneurons (IN), and astroglia progenitors (G). G Violin plots of GO term scores show differences between t-RG and RG populations (Wilcoxon test). H Cell type distributions by severity grade and sample. I UMAP plots split by individual samples. J UMAP depicting developmental trajectories from NE cells through RG to neuronal populations. Panels FJ: Analyses based on 23 organoids (control = 6, mild = 6, moderate = 5, severe = 6; two cell lines per condition), total 24,982 single cells. Scale bars: B, C 200 μm; D 50 μm. All statistical tests were performed as two-sided. Source data are provided as a Source Data file.
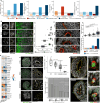
Fig. 2
Fig. 2. Transcriptomic and proteomic dysregulation in LIS1 patient-derived organoids across severity grades.
A Heatmap showing differentially expressed genes between control and mild, moderate, and severe LIS1-lissencephaly grades for genes expressed in all conditions (adjusted p < 0.05; |log₂FC| > 0.5). Top 10 genes with the largest absolute log₂FC per condition are annotated, where present in all three severity grades. Color intensity represents log₂FC. B Venn diagram showing overlap of differentially expressed genes between mild, moderate, severe, and control groups. C Venn diagram illustrating overlap of differentially expressed proteins among the same groups. D Heatmap displaying log₂FC (RNA) and Wilcoxon’s r (protein) for LIS1 and its interaction partners between severity grades and control. E Heatmap depicting the correlations of module eigengenes from WGCNA modules and severity grades. F STRING network of proteins in the WGCNA blue module, clustered by MCL (inflation parameter = 3). Only high-confidence interactions (score ≥ 0.700) are shown. G Representative widefield images of day 18 control and patient-derived organoids stained for HSP90α and BiP, counterstained with DAPI. White squares mark higher-magnification regions. H Map plot of overrepresented GO biological processes in differentially regulated genes and proteins; circle size indicates the number of features in each GO term. A, B, D, G, H: day 23 ± 3 organoids. Organoids analyzed: 23 total (control n = 6, mild n = 6, moderate n = 5, severe n = 6; two cell lines per condition). Single cells: control 8647; mild 3444; moderate 5168; severe 7723. CF, H: 2 independent lines per condition; control and mild: 4 samples each; moderate and severe: 6 samples each. Scale bars: G overviews 100 μm, details 20 μm. All statistical tests were performed as two-sided. Source data are provided as a Source Data file.
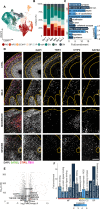
Fig. 3
Fig. 3. Probing selective molecular pathways identified in the OMICS analyses in LIS1-pateint-derived organoids.
A Bar graphs of –log₁₀-transformed p-values from GO molecular function enrichment for actin binding, actin filament binding, tubulin binding, and cytoskeleton structural constituent; nominal significance p = 0.05; p-value adjusted with Bonferroni correction; two-sided Hypergeometric test. B Representative day 20 organoids stained for acetylated α-tubulin (Ac-TUB); yellow dashed lines, apical/basal VZ regions. C Quantification of Ac-TUB strand density at day 20: n = 11 control (4 cell lines), 10 mild, 12 moderate, 18 severe (2 cell lines each), across four differentiations. VZ loops: 41, 54, 49, 80, respectively; two-sided Wilcoxon test. D Day 20 organoids stained for N-cadherin (N-CAD); yellow dashed lines, VZ edges and N-cadherin diameter expansion. E Quantification of apical N-CAD signal at day 20: VZ structures n = 32 control, 39 mild, 42 moderate, 43 severe for a total of 6, 8, 7, and 9 differentiations, respectively; 2 cell lines each; two-sided Kruskal–Wallis with post hoc Wilcoxon correction. F GO enrichment for cadherin binding; nominal significance p = 0.05; p-value adjusted with Bonferroni correction; two-sided Hypergeometric test. G Heatmap of log₂FC for WNT pathway genes in cycling progenitors by severity grade versus control (*P < 0.05, **P < 0.01, ***P < 0.001); two-sided Wilcoxon test. H WNT-GFP reporter organoids at day 20; yellow dashed lines, VZ boundaries. I Mean value of WNT-GFP intensity per VZ: n = 20 control (2 cell lines), 20 mild (2 cell lines), 10 moderate (one cell line), 10 severe (one cell line); 3 organoids per condition from two differentiations per cell line; two-sided Kruskal–Wallis with post hoc Wilcoxon correction. J Quantification of cell division plane orientation: n = 13 control, 12 mild, 12 moderate, 15 severe. VZ loops: 59, 56, 43, 57; cells: 206, 359, 172, 249, respectively; Chi-square test. K Examples of division planes in control and severe organoids; yellow dashed lines, VZ edges; white dashed lines, division plane orientation. Scale bars: B left 200 μm, B right, H 50 μm; D, K 20 μm; All boxplots show median, 25th/75th percentiles, and 1.5 interquartile range whiskers. Source data are provided as a Source Data file.
Fig. 4
Fig. 4. Probing therapeutic targets in LIS1 patient-derived organoids.
A Basal Ac-TUB strand density in DMSO- or EpoD-treated day 15 organoids. n = 6 organoids/group (3 moderate); VZs = 18/group (9 moderate), two differentiations/group, two genetic backgrounds (one moderate). Kruskal–Wallis with post hoc Wilcoxon. B N-CAD diameter in day 15 DMSO/EpoD-treated organoids. Each dot represents a VZ structure: 20 control, 20 mild, 6 moderate, 19 severe (6, 6, 3, 9 differentiations, respectively; two genetic backgrounds/conditions), pairwise Wilcoxon test. C VZ diameter on day 15 DMSO- and EpoD-treated control and LIS1-organoids. Each dot shows the mean of one differentiation: control DMSO = 5 organoids, EpoD = 7; mild DMSO = 6, EpoD = 6; moderate DMSO = 3, EpoD = 3; severe DMSO = 9, EpoD = 10. VZ: control DMSO = 27, EpoD = 39; mild DMSO = 28, EpoD = 24; moderate DMSO = 14, EpoD = 11; severe DMSO = 41, EpoD = 41. D VZ diameter on day 15 DMSO- and CHIR-treated organoids. Each dot indicates the mean of one differentiation: control DMSO = 7 organoids, CHIR = 6; mild DMSO = 6, CHIR = 7; moderate DMSO = 3, CHIR = 2; severe DMSO = 9, CHIR = 9. VZ: control DMSO = 27, CHIR = 38; mild DMSO = 28, CHIR = 23; moderate DMSO = 14, CHIR = 13; severe DMSO = 41, CHIR = 38; pairwise Wilcoxon test. E Cell division plane orientation in DMSO/CHIR-treated organoids. n = 6 organoids/group, 9 VZs/group; dividing cells: n = 50 control DMSO, 46 CHIR; 41 mild DMSO, 52 CHIR; 39 moderate DMSO, 31 CHIR; 40 severe DMSO, 49 CHIR; Chi square test. F and G Connectivity scores from CMap analysis for perturbagen classes (F) and modes of action (G) across severity groups; *P < 0.05, **P < 0.01, ***P < 0.001; individual p values are provided in Supplementary Data S24 (F) and S25 (G); Kolmogorov–Smirnov statistic vs. random query null distribution, as implemented by clue.io. H HuCD+ cells in DMSO/everolimus-treated organoids at day 20; differentiations: n = 4 control, 8 mild, 5 moderate, 4 severe; organoids: n = 19 control, 29 mild, 26 moderate, 28 severe; 2-way ANOVA with Bonferroni correction. I and J Representative images of organoids stained for GRP170 (I) and BiP (J) after everolimus. Scale bars: 125 μm. All statistical tests were performed as two-sided unless the Chi-square test. All boxplots show median, 25th/75th percentiles, and 1.5 interquartile range whiskers. Source data are provided as a Source Data file.
Fig. 5
Fig. 5. Transcriptomic dysregulation in neurons of late-stage LIS1 patient-derived organoids.
A UMAP dimensional reduction and unbiased clustering reveal 9 distinct color-coded cell populations within control, mild-, moderate- and severe LIS1 patient-derived organoids: RG, basal radial glia (bRG), extracellular matrix-enriched progenitors (ECM-P), stressed progenitors (SP), intermediate progenitors (IP), early-born neurons (ebN), excitatory neurons (EN), interneurons (IN) and stressed neurons (SN). B Cell type distribution in each severity grade, divided by sample. C GO enrichment of cytoskeleton-, synaptic- and axon-related terms among genes with log2FC > 0.5 (adj. p < 0.05) in the pooled neuronal clusters excluding the SN, showing fold-enrichment for biological processes (BP), molecular function (MF) and cellular components (CC). Fisher’s exact test with Benjamini–Hochberg correction. D Representative stainings of day 58 ± 2 control, mild, moderate and severe grade patient-derived organoids for the cortical layer specific markers TBR1, CTIP2 and SATB2 counterstained with Hoechst. The yellow dotted lines indicate the basal edges of the VZ, the blue dotted lines those of the NL regions. E Volcano plot of differential expression in the pooled neuronal clusters excluding the SN (severe vs. control), with stress-related genes highlighted. Statistical test: two-sided Wilcoxon Rank Sum test, with Benjamini–Hochberg correction. F GO and KEGG enrichment of stress-related terms among genes with log2FC > 0.5 (adj. p < 0.05) in the pooled neuronal clusters excluding the SN, showing fold-enrichment for biological processes (BP), molecular function (MF), cellular components (CC) and KEGG categories. Statistical test: Fisher’s exact test with Benjamini–Hochberg correction. Number of organoids and cells analyzed: 23 organoids, control N = 6, mild N = 3, moderate N = 3, severe N = 6 (cell lines per condition: 2 controls (5560 single cells), 1 LIS1 mild (1410 single cells), 1 LIS1 moderate (3925 single cells) and 2 LIS1 severe (5914 single cells). AC, E, F: day 60 ± 3 organoids. All statistical tests were performed as two-sided. Scale bars 50 µm.

References

    1. Lui, J. H., Hansen, D. V. & Kriegstein, A. R. Development and evolution of the human neocortex. Cell146, 18–36 (2011). - PMC - PubMed
    1. Severino, M. et al. Definitions and classification of malformations of cortical development: practical guidelines. Brain143, 2874–2894 (2020). - PMC - PubMed
    1. Francis, F. et al. Human disorders of cortical development: from past to present. Eur. J. Neurosci.23, 877–893 (2006). - PubMed
    1. Cardoso, C. The location and type of mutation predict malformation severity in isolated lissencephaly caused by abnormalities within the LIS1 gene. Hum. Mol. Genet.9, 3019–3028 (2000). - PubMed
    1. Singh, K. et al. Molecular mechanism of dynein–dynactin complex assembly by LIS1. Science383, 1431–1448 (2024). - PMC - PubMed

MeSH terms

Substances

LinkOut - more resources