Research literacy and its predictors among university students and graduates identified by machine learning and spatial analysis
- PMID: 41083527
- PMCID: PMC12518792
- DOI: 10.1038/s41598-025-19488-4
Research literacy and its predictors among university students and graduates identified by machine learning and spatial analysis
Abstract
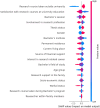
The landscape of academic publishing has evolved dramatically, leading to a surge in publications and journals. The 'publish or perish' culture has resulted in undesirable practices, such as many researchers publishing in predatory journals due to institutional pressures and lack of awareness. While numerous studies have investigated knowledge of predatory journals, overall research literacy has remained underexplored. This study is the first to assess research literacy comprehensively, incorporating GIS and machine learning techniques alongside traditional statistical analyses. This study utilized a cross-sectional survey method with a questionnaire collecting information on socio-demographics, academic information, research training and experience, and research literacy. Traditional statistical analyses were performed using SPSS, while machine learning models were developed with Python and Google Colab. Supervised classification algorithms and mapping with R statistical software's 'bangladesh' package. The findings revealed that over half of the participants had poor research literacy. Significant predictors of higher research literacy included satisfaction with research courses at university education, research course taken outside university , and research-related professional engagement. Machine learning analysis identified that taking research courses outside of university was the most impactful factor for research literacy, while researchers within family members had minimal influence. The Random Forest and CatBoost models performed strongly in predicting literacy, achieving accuracy rates of 73.04% and 71.57%, respectively, and precision values of 73.29% and 71.69%, respectively, with low log loss values of 0.57 and 0.56. GIS-based spatial analyses revealed regional disparities in research literacy (χ²=9.234, p = 0.236), with certain divisions exhibiting a higher prevalence of lower literacy. This study highlights that a substantial portion of the participants lack research literacy, which is associated with multiple factors. The findings suggest the need for intervention programs to enhance research practices and awareness among students and professionals, fostering a culture of academic excellence.
Keywords: Plagiarism; Predatory journals; Research evaluation; Research literacy; Research training; Thesis students.
© 2025. The Author(s).
Conflict of interest statement
Declarations. Competing interests: The authors declare no competing interests. Ethics approval and consent to participate: Before the study implementation, it received approval from the Institutional Review Board at Patuakhali Science and Technology University, Bangladesh [Reference Number: PSTU/IEC/2023/81]. Besides, the study adhered to the principles outlined in the revised Helsinki Declaration of 2013, ensuring ethical standards for human subject participation were met. Participants were informed about the purpose and objectives of the study through a brief description at the beginning of the questionnaire, where their written informed consent was sought for participation. They were assured of their right to withdraw from the study at any time without any obligation. It is important to note that no monetary or non-monetary remuneration or benefits were offered for participation in the study. Informed consent: Participants were informed about the purpose and objectives of the study through a brief description at the beginning of the questionnaire, where their written informed consent was sought for participation.
Figures


References
-
- Musa, Z. How many journal articles have been published? 2023. Retrieved from: https://publishingstate.com/how-many-journal-articles-have-been-publishe...
-
- Demir, S. B. Predatory journals: who publishes in them and why? J. Informetr.12, 1296–1311. 10.1016/j.joi.2018.10.008 (2018).
MeSH terms
LinkOut - more resources
Full Text Sources

