. 2025 Oct 14;23(1):677.
doi: 10.1186/s12951-025-03730-2.

Neuron-targeted ROS-responsive liposomes for puerarin delivery remodel ischemic microenvironment via microglial modulation and neurovascular regeneration

Affiliations

Neuron-targeted ROS-responsive liposomes for puerarin delivery remodel ischemic microenvironment via microglial modulation and neurovascular regeneration

Di Chen et al. J Nanobiotechnology. .

Abstract

Ischemic stroke triggers the "ischemic cascade," which encompasses vascular injury, oxidative stress, inflammatory responses, and mitochondrial dysfunction, ultimately leading to neuronal death and impaired brain function. Conventional pharmacotherapies have specific limitations, such as being restricted by the blood-brain barrier (BBB), causing systemic side effects, and having poor lesion targeting. To tackle the aforementioned challenges, this study developed PUELipo/R-R, a safe and highly biocompatible liposome nanocarrier modified with reactive oxygen species (ROS)-responsive DSPE-TK-PEG and neuron-targeting RVG29 peptide on the surface, for the precise delivery of puerarin (PUE) to ischemic brain regions and the release of stimuli-responsive drugs. PUE demonstrates the advantage of multi-target regulation in treating ischemic stroke. In a mouse model of middle cerebral artery occlusion/reperfusion (MCAO/r), PUELipo/R-R significantly reduced the volume of cerebral infarction, decreased neuronal death rate, and improved post-stroke motor function. The results of single-cell RNA sequencing (scRNA-seq) revealed that endothelial cells (ECs) and microglia were the cell types with the most significant alterations in the experimental group treated with PUELipo/R-R. Both in vitro and in vivo studies have verified that PUELipo/R-R enhances the expression levels of angiogenesis-related factors, promotes the proliferation, migration, and angiogenesis of cerebrovascular ECs, and improves neuroinflammatory conditions by facilitating the transformation of microglia from the pro-inflammatory M1 phenotype to the anti-inflammatory M2 phenotype. This novel multi-target therapeutic strategy highlights the potential application of PUELipo/R-R as a possible treatment for ischemic stroke and related disorders.

Keywords: Cerebral ischemia; Liposome; Microglia polarization; Neuron-targeting; Neurovascular regeneration; Puerarin; ROS-responsive.


Conflict of interest statement

Declarations. Competing interests: The authors declare no competing interests.

Figures

Fig. 1
Fig. 1
Schematic illustration of PUELipo/R-R’s therapeutic mechanisms. The liposome carrier binds to blood–brain barrier constituent cells via RVG29 and accumulates in the ischemic brain through receptor-mediated endocytosis. Subsequently, in ROS-enriched microenvironments around ischemic penumbra, DSPE-TK-PEG is triggered to induce liposome disintegration and drug release. The liberated PUE exerts multi-therapeutic efficacy by promoting angiogenesis and regulating microglial polarization (M1 → M2 transition)
Fig. 2
Fig. 2
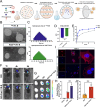
Preparation and Characterization of PUELipo/R-R. Physicochemical characterization of PUELipo/R-R. A Flowchart of preparation of PUELipo/R-R. B TEM image of PUELipo/R-R and Lipo/R-R liposomes (scale bar: 100 nm). C Size distribution of PUELipo/R-R andLipo/R-R liposomes. D Zeta potential of PUELipo/R-R andLipo/R-R by nanometer particle size potentiometer (n = 3). E The cumulative release of PUE from PUELipo/R-R in 5 mM H2O2 and PBS (n = 3). F IVIS images of MCAO/r mice after injection of DiD-labeled PUELipo/R-R and free DiD at 1 h, 4 h, and 8 h. G Ex vivo IVIS imaging of the brain in MCAO/r mice 8 h after injection of DiD-labeled PUELipo/R-R and DiD. H Statistical analysis of fluorescence intensity in removed brains of MCAO/r mice 8 h after injection of DiD-labeled PUELipo/R-R and DiD, n = 3, *** p < 0.001. I Representative Immunofluorescence images of distribution of DiD (red) in bEnd.3 cell line treated with free DiD and DiD-PUELipo/R-R after 1 h. J Statistical analysis of relative fluorescence intensity of DiD, n = 4, *** p < 0.001
Fig. 3
Fig. 3
PUELipo/R-R improves locomotor ability in MCAO/r mice. Four behavioral tests were performed to assess the locomotor ability of mice in the Sham, MCAO/r, PUELipo/R-R andLipo/R-R groups. A Statistical analysis of the mNSS of the four groups at day 1 and 7, n = 8, * p < 0.05, ** p < 0.01, **** p < 0.0001. B Statistical analysis of the residence time on the rotating bar in the Rotarod test of the four groups, n = 8, * p < 0.05, **** p < 0.0001. C Motion trajectory diagrams of the four groups in the Open Field Test. D Statistical analysis of crossing times and move distance in the four groups of mice in the Open field test, n = 5, * p < 0.05, ** p < 0.01, *** p < 0.001, **** p < 0.0001. E Footprint images of four groups of mice in the CatWalk XT gait test. F Statistical analysis of total distance, duration, speed, and cadence of the four groups of mice in the CatWalk XT gait test, n = 5, * p < 0.05, *** p < 0.001, **** p < 0.0001
Fig. 4
Fig. 4
PUELipo/R-R attenuated cerebral infarct volume and preserved neurons in ischemic penumbra of MCAO/r mice. 7 days after MCAO/r, multiple methods were employed to detect cerebral infarction volume and neuronal survival in the infarct area among different groups of mice. A TTC staining demonstrating that the infarcted brain tissue appeared white, while the normal brain tissue exhibited red coloration. B Representative immunofluorescence images of NeuN staining (NeuN, green; Dapi, blue). C Statistical analysis of infarct size in the three groups, n = 5, * p < 0.05. D Representative ×40 immunofluorescence images of TUNEL staining (Dapi, blue; TUNEL, red). E Statistical analysis of the number of TUNEL-positive cells in the four groups, n = 5, * p < 0.05, ** p < 0.01, *** p < 0.001. F Nissl staining in the cerebral cortex of ischemic areas. G Statistical analysis of Nissl bodies in the cerebral cortex of ischemic areas in the four groups, n = 5, * p < 0.05, **** p < 0.0001. H Representative ×40 Nissl staining in the CA1, CA3, and DG regions of the hippocampus within ischemic areas. I Statistical analysis of Nissl bodies in the CA1, CA3, and DG regions of the hippocampus within ischemic areas in the four groups, n = 5, * p < 0.05, ** p < 0.01, **** p < 0.0001
Fig. 5
Fig. 5
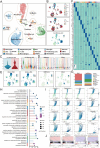
PUELipo/R-R modulates cellular stemness and immune responses following ischemic stroke through transcriptional regulation of endothelial cells and microglia. A The UMAP plot showing the distribution of 16 cell types in the mouse ischemic stroke model, with individual cells colored according to their cell types. The 16 cell types included: monocytes, oligodendrocytes, ECs, microglia, neurons, DCs, T cells, pericytes, proliferating cells, SMCs, astrocytes, macrophages, CPECs, neutrophils, fibroblasts, and B cells. B From top to down, the UMAP plots displayed the proportion of cell types and cell cycle phases in PUELipo/R-R and MCAO/r samples, and the score for cell stemness AUC. PUELipo/R-R represented the ischemic stroke mouse model treated with PUELipo/R-R drug, and MCAO represented the ischemic stroke control group. C The violin plots displayed the scores of gene stemness AUC for two groups and all cell types. D The violin plots showed the 16 cell types for the score of G2M and S score. E The UMAP plots displayed the score of nCount RNA, nFeature RNA, G2M.Score, S.Score for all cell types. F The Heatmap showed the expression of the top 5 marker genes in each of the cell type. G Stacked bar plots showed the distribution differences of the 16 cell types between the PUELipo/R-R and MCAO/r groups. H GO enrichment analysis result for the 16 cell types. I Volcano plots displayed the up-regulated and down-regulated DEGs of the 16 cell types. J The GSEA enrichment results of ECs and microglia
Fig. 6
Fig. 6
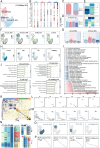
Mechanistic investigation of PUELipo/R-R affecting endothelial cells in ischemic penumbra region. A The UMAP plot showing the distribution of four ECs subtypes in the ischemic stroke model. B Bubble plot showed the expression of the top 5 DEGs in the four ECs subtypes and different sample types. C Stacked bar charts described the distribution of the ECs subtypes in PueRR@Lipo and MCAO groups. D The bar plot showed the score of cell stemness AUC of four ECs subtypes. E The heatmaps showed the Ro/e values for four ECs subtypes in different sample types and at different cell cycle phases, in order to quantify the distribution deviations of these cells. F The UMAP plots displayed the scores for nCount RNA, nFeature RNA, G2M.Score, and S.Score for ECs. G The bar plots showed the score of nCount RNA and nFeature RNA of four ECs subtypes. H UMAP plots showed the expression distribution of named genes for four ECs subtypes. I GO enrichment analysis results for the four ECs subtypes. J Bar charts displayed the GO-BP enrichment analysis results for the four ECs subtypes. K The heatmap displayed the identification of six regulatory modules in ECs subtypes. L The scatter plots displayed the ranking of TFs regulatory activity scores for different ECs subtypes in six modules. M Regulons in module M1, M2, M3, M4, M5, M6. N The heatmaps showed the expression of the top 5 TFs in each ECs subtype, sample type and cell cycle phase. O UMAP distribution of four ECs subtypes. P Ranking of the top 5 TFs activity scores of different ECs subtypes
Fig. 7
Fig. 7
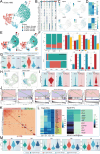
Mechanistic investigation of PUELipo/R-R affecting microglial cells in ischemic penumbra region. A The UMAP plot showing the distribution of four microglial subtypes in the mouse ischemic stroke model. B The bubble plot showed the expression of the top 10 marker genes in each of the four microglial subtypes. C The UMAP plots showed the four microglial subtypes annotation based on named genes expression. D The heatmaps showed the Ro/e values for each microglial subtype in different cell cycle phases and different sample types, in order to quantify the distribution deviations of microglial. E The UMAP plots showed the distribution of microglial across different sample types and cell cycle phases. F Stacked bar charts and bar plots further revealed the distribution of each microglial subtype across different sample types and cell cycle phases. G The violin plots showed the value of nCount RNA and nFeature RNA for four microglial subtypes. H The UMAP plots showed the AUC score of nCount RNA and nFeature RNA for four microglial subtypes. I The violin plots showed the expression level of four named genes in two sample types. J GSEA results showed the positive and negative enrichments in four microglial subtypes. K The heatmap displayed the identification of five regulatory modules in microglial subtypes. L The heatmap showed the expression of the top 5 TFs in each microglial subtype and sample type. M The violin plots showed AUC value of four microglial subtypes in five modules comprised of M1, M2, M3, M4, M5
Fig. 8
Fig. 8
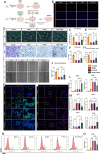
PUELipo/R-R exerts pro-angiogenic effect in vitro following OGD/r and modulates microglia polarization in vitro following OGD/r. Using bEnd.3 cells for OGD/r modeling and corresponding interventions, four related experiments were conducted to investigate the effects of PUELipo/R-R on cerebrovascular angiogenesis. A The process of in vitro cell experiments. B Representative ×20 immunofluorescence images of EdU staining (Dapi, blue; EdU, red). C Statistical analysis of the number of EdU positive cells in the four groups, n = 3, * p < 0.05, *** p < 0.001. D Representative image of wound healing test. E Statistical analysis of migration rate in wound healing test, n = 3, ** p < 0.01, **** p < 0.0001. F Representative image of cell migration in transwell migration assay. G Statistical analysis of cell count in transwell migration assay in the four groups, n = 3,* p < 0.05, **** p < 0.0001. H ×40 magnification of blood vessel formation. I Statistical analysis of junction number in the four groups, n = 3, * p < 0.05, ** p < 0.01, **** p < 0.0001. J Statistical analysis of tube length in the four groups, n = 3, ** p < 0.01, **** p < 0.0001. K Representative ×40 immunofluorescence images of four sets of CD86 and CD206 staining (Dapi, blue; CD206, red; CD86, green) white solid line squares show the locally enlarged images. L Statistical analysis of the fold change of fluorescence intensity of CD86 and CD206, n = 3, ** p < 0.01, **** p < 0.0001. M Statistical analysis of expression of CD86, iNOS, CD206, and ARG1 mRNA, n = 3, * p < 0.05, ** p < 0.01, *** p < 0.001, **** p < 0.0001. N Flow cytometry images, blank group represents unstained cells. O Statistical analysis of the proportion of CD86 active cells, n = 3, *** p < 0.001, **** p < 0.0001
Fig. 9
Fig. 9
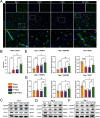
PUELipo/R-R promotes neurovascular regeneration in ischemic penumbra of MCAO/r mice. A Representative ×80 immunofluorescence images of four sets of CD31 and Ki67 staining (Dapi, blue; Ki67, red; CD31, green) white solid line squares show the locally enlarged images. B Statistical analysis of cell count of Ki67 and CD31 positive cells, n = 5, ** p < 0.01. Representative WB images of VEGFA, VEGFR2, and CD31 expression in the four groups on day 3 (C), 5 (D) and 7 (E). Statistical analysis of the expression of VEGFA, VEGFR2, and CD31 in each of the four groups on day 5 (F) and 7 (G), n = 5, * p < 0.05, ** p < 0.01, *** p < 0.001
Fig. 10
Fig. 10
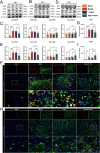
PUELipo/R-R modulates microglial polarization in ischemic penumbra of MCAO/r mice. Representative WB images of CD86, iNOS, CD206 and ARG1 expression in the four groups on day 3 (A), 5 (B) and 7 (D). Statistical analysis of the expression of CD86, iNOS, CD206 and ARG1 in each of the four groups on day 5 (C) and 7 (E), n = 3, * p < 0.05, ** p < 0.01, *** p < 0.001, **** p < 0.0001. F Representative ×80 immunofluorescence images of four sets of CD86 and Iba-1 staining (Dapi, blue; CD86, red; Iba-1, green) white solid line squares show the locally enlarged images. G Statistical analysis of the fluorescence intensity of CD86, n = 5, *** p < 0.001, **** p < 0.0001. H Representative ×80 immunofluorescence images of four sets of CD206 and Iba-1 staining (Dapi, blue; CD206, red; Iba-1, green) white solid line squares show the locally enlarged images. I Statistical analysis of the fluorescence intensity of CD206, n = 5, * p < 0.05

References

    1. Pu L, Wang L, Zhang R, Zhao T, Jiang Y, Han L. Projected global trends in ischemic stroke incidence, deaths and disability-adjusted life years from 2020 to 2030. Stroke. 2023;54:1330–9. - PubMed
    1. Fan J, Li X, Yu X, Liu Z, Jiang Y, Fang Y, et al. Global burden, risk factor analysis, and prediction study of ischemic stroke, 1990–2030. Neurology. 2023;101:e137–50. - PMC - PubMed
    1. Paul S, Candelario-Jalil E. Emerging neuroprotective strategies for the treatment of ischemic stroke: an overview of clinical and preclinical studies. Exp Neurol. 2021;335:113518. - PMC - PubMed
    1. Shehjar F, Maktabi B, Rahman ZA, Bahader GA, James AW, Naqvi A, et al. Stroke: molecular mechanisms and therapies: update on recent developments. Neurochem Int. 2023;162:105458. - PMC - PubMed
    1. Muresanu DF, Strilciuc S, Stan A. Current drug treatment of acute ischemic stroke: challenges and opportunities. CNS Drugs. 2019;33:841–7. - PubMed

LinkOut - more resources