. 2025 Oct 14;11(1):114.
doi: 10.1038/s41540-025-00591-1.

Multi-omic network inference from time-series data

Affiliations

Multi-omic network inference from time-series data

María Moscardó García et al. NPJ Syst Biol Appl. .

Abstract

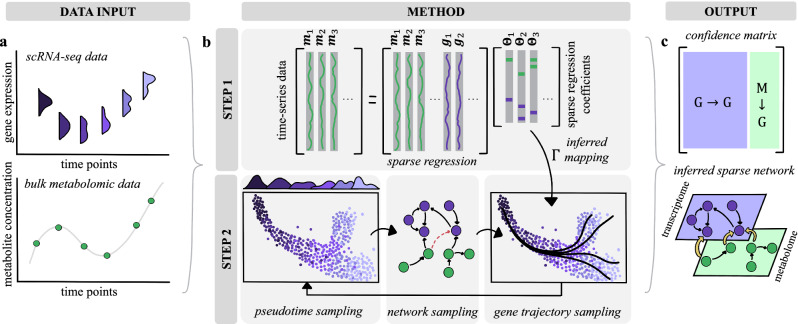
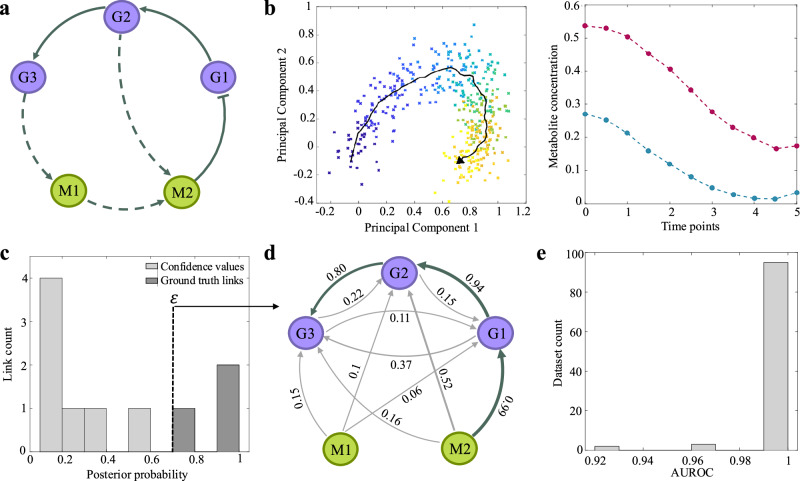
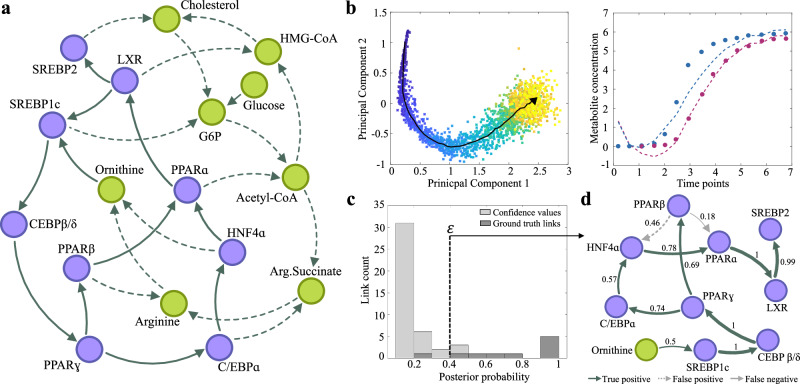
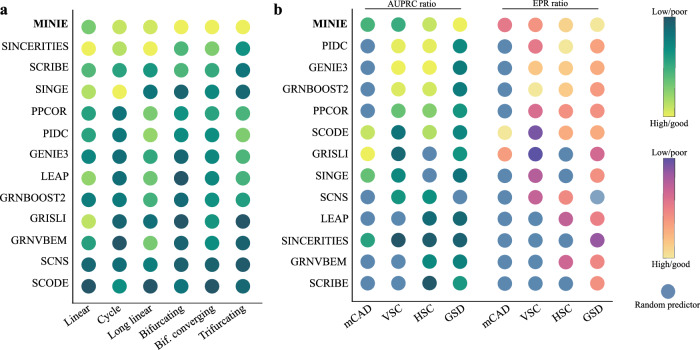
Biological phenotypes emerge from complex interactions across molecular layers. Yet, data-driven approaches to infer these regulatory networks have primarily focused on single-omic studies, overlooking inter-layer regulatory relationships. To address these limitations, we developed MINIE, a computational method that integrates multi-omic data from bulk metabolomics and single-cell transcriptomics through a Bayesian regression approach that explicitly models the timescale separation between molecular layers. We validate the method on both simulated datasets and experimental Parkinson's disease data. MINIE exhibits accurate and robust predictive performance across and within omic layers, including curated multi-omic networks and the lac operon. Benchmarking demonstrated significant improvements over state-of-the-art methods while ranking among the top performers in comprehensive single-cell network inference analysis. The integration of regulatory dynamics across molecular layers and temporal scales provides a powerful tool for comprehensive multi-omic network inference.


Conflict of interest statement

Competing interests: The authors declare no competing interests.

Figures

Fig. 1
Fig. 1. Method overview.
a The input of MINIE consists of time-series bulk metabolomics and scRNA-seq data. Note that time-series scRNA-seq data can be interpreted as time-dependent distributions of gene expression across measured cells, sampled at specific time points. b MINIE's algorithm is divided into two steps: transcriptome–metabolome mapping inference (top) and network inference using Gaussian regression (bottom). Step 1: Bulk metabolomic and transcriptomic data (obtained by averaging the scRNA-seq data across cells) are used as inputs in this step. The diagram illustrates the sparse regression problem, which consists of determining the coefficients of Θ from the metabolite concentrations m(t) and bulk gene expressions g(t). These coefficients enable the inference of the transcriptome–metabolome mapping Γ, which is further used to estimate the metabolomic trajectories at the single-cell level. Step 2: Three MCMC samplers are employed iteratively to estimate the parameters of the underlying regulatory model, including the network topology. First, the pseudotime values are estimated from the scRNA-seq data, assigning each sampled cell a unique time point reflecting its progression. Second, the network topology is sampled (by randomly adding/deleting edges) together with other model parameters. Third, the gene trajectories are sampled from the Bayesian model, fitting the data. c The final output is a confidence matrix with the probability of existence for all regulatory interactions in the transcriptome (i.e., gene-gene and metabolite-to-gene links).
Fig. 2
Fig. 2. Performance on linear network motifs.
a Multi-layer network of genes (purple) and metabolites (green). Solid arrows depict activating (sharp) and inhibiting (blunt) interactions to be inferred by MINIE, while dashed arrows indicate known metabolic interactions. b Artificially-generated transcriptomic (left) and metabolomic (right) data by a linear SDE model. Left: Projection of the single-cell data using principal component analysis (PCA). Each data point represents the gene expression level of a measured cell, colour-coded by sampling time (ordered from blue to yellow). The arrow shows the pseudotime trajectory estimated by MINIE. Right: Bulk metabolic concentrations (dots) and inferred trajectories (dashed lines) using MINIE's transcriptome–metabolome mapping. c Histogram of predicted confidence values for the existence of each link, where true positive links are represented by a dark shade. d Reconstructed network based on predicted probabilities for ε = 0.7. The true links and non-existing links are respectively represented by green and grey arrows, weighted according to the confidence values predicted by MINIE. e Distribution of AUROC scores across 100 datasets with different initial conditions.
Fig. 3
Fig. 3. MINIE’s performance on nonlinear multi-omic model.
a Multi-omic network of genes (purple) and metabolites (green). Solid arrows depict interactions to be inferred by MINIE, while dashed arrows indicate known metabolic interactions input as prior knowledge. b Artificially-generated transcriptomic (left) and metabolomic (right) data by the BoolODE algorithm. Left: Projection of the single-cell data using PCA. The arrow shows the pseudotime trajectory estimated by MINIE. Right: Bulk metabolic concentrations (dots) and inferred metabolomic trajectories (dashed lines) using the mapping Γ. c Histogram of predicted probability values for the existence of each link, where true positive links are represented by a dark shade. d Reconstructed network based on predicted probabilities for ε = 0.4. The true links (solid green), false positives (dotted grey), and false negatives (solid grey) are represented by arrows weighted according to the confidence value predicted by MINIE.
Fig. 4
Fig. 4. MINIE’s performance on Escherichia coli lac operon.
a Multi-omic regulatory network of genes/proteins (purple) and metabolites (green) of the lac operon model. Solid arrows depict interactions to be inferred by MINIE, while dashed arrows indicate known metabolic interactions input as prior knowledge. b Artificially-generated transcriptomic (left) and metabolomic (right) data simulating a nutrient-rich repression phase, with decreasing levels of lactose. Left: Projection of the single-cell data using PCA. The arrow shows the pseudotime trajectory estimated by MINIE. Right: Bulk metabolic concentrations (dots) and inferred metabolomic trajectories (dashed lines) using the mapping Γ for lactose (blue) and allolactose (magenta). c Histogram of predicted probability values for the existence of each link, where true positive links are represented by a dark shade. d Reconstructed network based on predicted probabilities for ε = 0.8. The true links and non-existing links are respectively represented by green and grey arrows, weighted according to the confidence values predicted by MINIE.
Fig. 5
Fig. 5. Benchmark of MINIE against state-of-the-art GRN inference methods.
a Receiver-operating characteristic curves and b precision-recall curves of MINIE, BINGO and dynGENIE3. The results show that MINIE (AUROC = 0.93, AUPRC = 0.86) outperforms both BINGO (AUROC = 0.80, AUPRC = 0.78) and dynGENIE3 (AUROC = 0.79, AUPRC = 0.77).
Fig. 6
Fig. 6. Benchmark of MINIE using the BEELINE pipeline.
a Performance on BEELINE synthetic networks. Each column corresponds to a different network motif, while rows represent GRN inference methods. The performance scores are averaged over the 20 datasets with 2000 and 5000 cells generated in the original study. The GRN inference methods are ordered in descending order based on the median value of their median AUPRC ratios across all motifs. b Performance on BEELINE curated networks. The two sets of columns represent the EPR and median AUPRC ratios. The curated networks include mCAD (mammalian cortical area development), VSC (ventral spinal cord), HSC (hematopoietic stem cell differentiation), and GSD (gonadal sex determination). The performance scores are averaged over the 10 datasets without considering dropouts. The performance values included in this figure, except for MINIE's, are obtained from ref. .
Fig. 7
Fig. 7. Multi-omic network inference for the Parkinson’s disease datasets.
Time-series transcriptomic (upper) and metabolomic (lower) data for a PINK1 mutant and b healthy samples. Upper: Projection of the single-cell data using PCA. The arrow shows the pseudotime trajectory estimated by MINIE; the trajectory does not pass through the point clouds due to significant zero inflation in the data (which is accounted for by a weighting scheme described in “Methods” section). Lower: Bulk metabolic concentrations (dots) and inferred metabolomic trajectories (dashed lines) using MINIE's transcriptome–metabolome mapping. For illustration purposes, just two metabolites are shown: phenylalanine (purple) and glutamate (blue). c Histograms of predicted probability values for the existence of each link, considering gene-gene interactions (left panel), metabolite-to-gene interactions (middle panel), and perturbation targets (right panel). d Reconstructed network based on confidence values for ε2 = 0.06. Only genes (purple) and metabolites (green) with regulatory links are included (node size is proportional to the degree of each node). PINK1, the gene responsible for the mutation under study, is highlighted in bold. e Reconstructed network for ε1 = 0.04.

References

    1. Baysoy, A., Bai, Z., Satija, R. & Fan, R. The technological landscape and applications of single-cell multi-omics. Nat. Rev. Mol. Cell Biol.24, 695–713 (2023). - PMC - PubMed
    1. Forrow, A. & Schiebinger, G. LineageOT is a unified framework for lineage tracing and trajectory inference. Nat. Commun.12, 4940 (2021). - PMC - PubMed
    1. Aalto, A., Viitasaari, L., Ilmonen, P., Mombaerts, L. & Gonçalves, J. Gene regulatory network inference from sparsely sampled noisy data. Nat. Commun.11, 3493 (2020). - PMC - PubMed
    1. Volkova, S., Matos, M. R., Mattanovich, M. & de Mas, I. M. Metabolic modelling as a framework for metabolomics data integration and analysis. Metabolites10, 303 (2020). - PMC - PubMed
    1. Yasemi, M. & Jolicoeur, M. Modelling cell metabolism: a review on constraint-based steady-state and kinetic approaches. Processes9, 322 (2021).

LinkOut - more resources