. 2025 Oct 14;11(1):292.
doi: 10.1038/s41531-025-01062-4.

Decreased SNCA expression in whole-blood RNA analysis of Parkinson's disease adjusting for neutrophils

Affiliations

Decreased SNCA expression in whole-blood RNA analysis of Parkinson's disease adjusting for neutrophils

Kayla Y Xu et al. NPJ Parkinsons Dis. .

Abstract

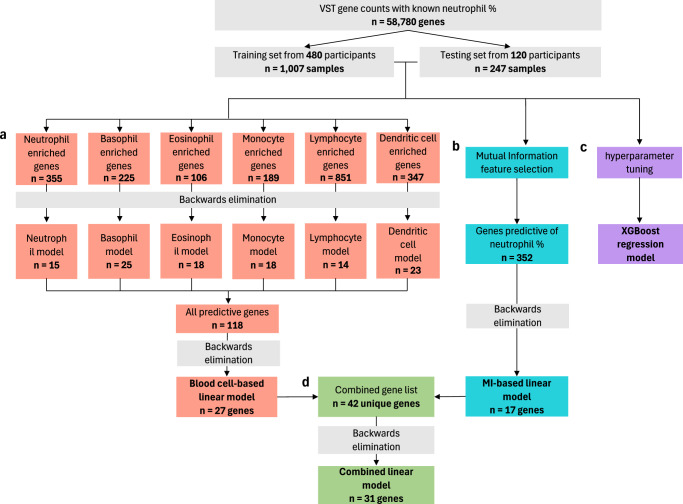
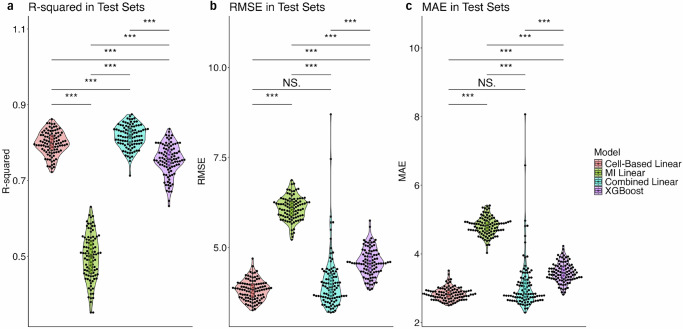
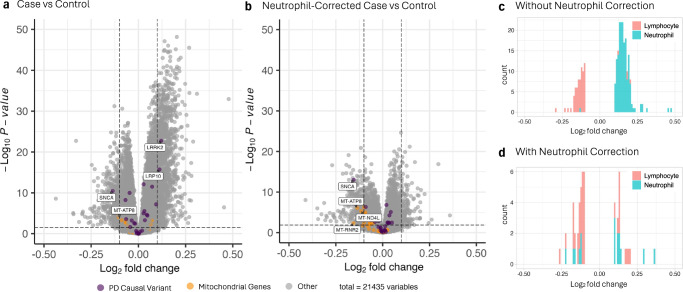
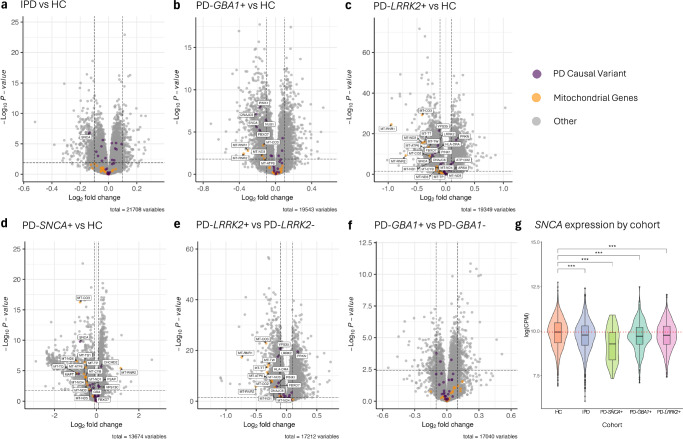
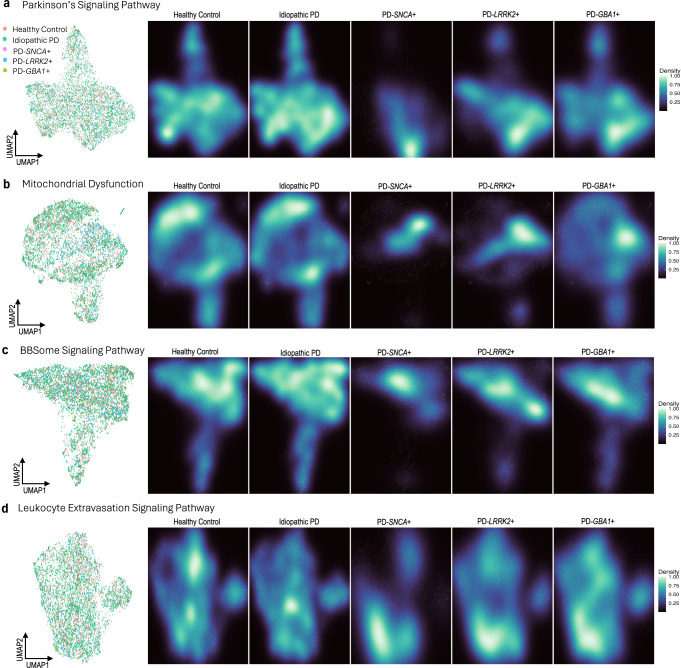
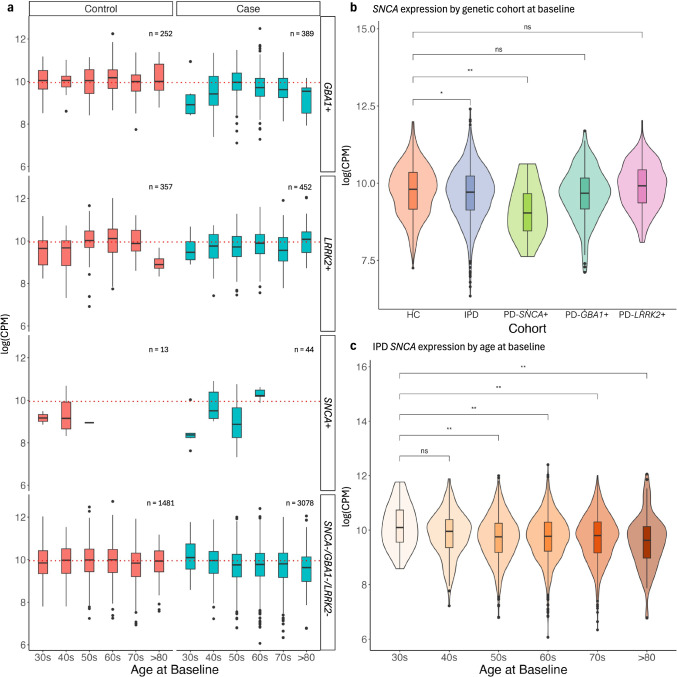
Blood-based RNA transcriptomics offers a promising avenue for identifying biomarkers of Parkinson's disease (PD) progression and mechanisms of pathogenesis. Previous work uncovered an age-related increase of neutrophil-enriched gene expression in PD whole blood, which may obscure disease-relevant transcriptomic signals. To better capture PD-associated molecular differences, we analyzed PD whole-blood RNA sequencing data using a differential expression approach that accounts for neutrophil composition. We built a model to estimate neutrophil percentages in 6897 Parkinson's Progression Markers Initiative and Parkinson's Disease Biomarkers Program samples from gene expression. By incorporating predicted neutrophil percentages as a covariate, we see significant SNCA downregulation in all PD cohorts, a signal previously obscured by immune cell-related effects. Lowered SNCA expression was observed in individuals with known PD-linked gene mutations (e.g., SNCA, GBA1, LRRK2) and those without known pathogenic variants. These findings suggest that decreased SNCA expression in whole blood may be a defining transcriptomic feature of PD.


Conflict of interest statement

Competing interests: The authors declare no competing interests.

Figures

Fig. 1
Fig. 1. Workflow diagram of regression model development for predicting neutrophil percentage from gene expression data.
1254 passing samples with CBC test results were used to create machine learning regression models to predict neutrophil percentage. a, b, d Train-test splits for regression model development were created by randomly splitting the 600 unique participants between an 80% train set and 20% test set, then assigning the respective samples to the corresponding set. Three different linear models were created to compare the performance of different methods of feature selection: a biology-based via selection of only blood cell enriched genes, b data-driven via mutual information feature selection from all genes, and d combining the methods to include genes from both biology-based and data-driven selection. c Additionally, an XGBoost regression model (c) was developed with all 58,780 transformed gene counts. We used the best-performing model to predict neutrophil percentage for 2932 PDBP samples and 2711 PPMI samples with no known neutrophil percentage.
Fig. 2
Fig. 2. Comparison of different machine learning models to predict neutrophil percentage in PPMI and PDBP patients.
ac Each model type was trained and tested on 100 train-test splits of 1254 samples with known neutrophil percentage, where samples were split 0.8–0.2 by participants. a plots the R2 value of each model when applied to the test sets, b plots the root mean squared errors, and c plots the mean absolute errors. A Wilcoxon signed-rank test was used to test the statistical significance of differences between the models for each metric. *, **, *** indicate p values less than 0.05, 0.01. and 0.001, while N.S. indicates no significance.
Fig. 3
Fig. 3. Differential expression in patients comparing cases to controls, with and without controlling for predicted neutrophil percentage.
Volcano plots of differentially expressed genes, without controlling for predicted neutrophil percentage (a) and with controlling for predicted neutrophil percentage (b) in the design matrix. Genes with a log2 fold change of >0.1 or <−0.1 and adjusted p value > 0.05 are considered differentially expressed. Genes that are either known PD causal variants or mitochondrial genes are colored purple and orange, respectively. PD causal variants and mitochondrial genes that are differentially expressed are additionally labeled by their gene name. Histograms showing the distribution of significantly differentially expressed neutrophil- and lymphocyte-enriched genes in the differential expression analysis without (c) and with d controlling for predicted neutrophil percentage.
Fig. 4
Fig. 4. Differential expression analysis of all samples by genetic cohort.
PD causal variants are colored purple, and mitochondrial genes are colored orange. Differentially expressed PD causal variants and mitochondrial genes are additionally labeled by gene name. a Idiopathic case samples with no SNCA/LRRK2/GBA1 mutations were compared to control samples with no PD-related mutations (i.e., HC). HC samples were compared to case samples with GBA1+ (b), LRRK2+ (c), and SNCA+ (d) mutations. e LRRK2+ case samples were compared to LRRK2− case samples. f GBA1+ case samples were compared to GBA1 case samples. g log(CPM) SNCA expression in HC, IPD, SNCA+ case, GBA1+ case, and LRRK2+ case samples corrected by predicted neutrophil percentage, stratified by genetic cohort. Adjusted p values are labeled according to the adjusted p value of SNCA differential expression from respective DE analyses. The dotted red line represents the median SNCA expression in HC samples. *, **, *** indicate p values less than 0.05, 0.01. and 0.001, while N.S. indicates no significance.
Fig. 5
Fig. 5. UMAP dimensionality reduction with pathway-specific genes by disease status and genetic cohort.
UMAP embeddings were created from VST gene counts. Counts were then corrected for participant age and sex, as well as sample mRNA percentage and predicted neutrophil percentage. a UMAP of 36 genes found in the ‘Parkinson’s Signaling Pathway’, with samples labeled by disease and genetic status, excluding samples from participants with unknown genetic status (n = 5470). Corresponding density plots were made, stratified by disease and genetic status. b A UMAP and set of density plots were created from 143 genes in the ‘Mitochondrial Dysfunction’ pathway (n = 5339). c A UMAP of 59 ‘BBSome Signaling Pathway’ genes and density plots (n = 5358). d UMAP and density plots of 52 ‘Leukocyte Extravasation Signaling Pathway’ genes (n = 5345). In bd, a small cluster of ‘Healthy Control’ and ‘Idiopathic PD’ samples was removed for visualization purposes.
Fig. 6
Fig. 6. SNCA expression stratified by demographic, clinical, and biological factors.
ac Gene counts were log(CPM) normalized and corrected for predicted neutrophil percentage. a SNCA expression in samples stratified by genetic status and diagnosis. The dotted red line represents the median SNCA expression in HC samples (i.e., ‘Control’ and ‘SNCA−/GBA1−/LRRK2−’). b SNCA expression of HC, IPD, PD-SNCA+ samples, PD-GBA1+ samples, and PD-LRRK2+ samples at baseline only. c SNCA expression of IPD samples over age at baseline. All p values were calculated using a Wilcoxon rank-sum test. *, **, *** indicate p values less than 0.05, 0.01. and 0.001, while N.S. indicates no significance.

Update of

References

    1. Dorsey, E. R., Sherer, T., Okun, M. S. & Bloem, B. R. The emerging evidence of the Parkinson pandemic. J. Parkinsons Dis.8, S3–S8 (2018). - PMC - PubMed
    1. Tolosa, E., Garrido, A., Scholz, S. W. & Poewe, W. Challenges in the diagnosis of Parkinson’s disease. Lancet Neurol.20, 385–397 (2021). - PMC - PubMed
    1. Rizzo, G. et al. Accuracy of clinical diagnosis of Parkinson disease: a systematic review and meta-analysis. Neurology86, 566–576 (2016). - PubMed
    1. Oftedal, L., Maple-Grodem, J., Tysnes, O. B., Alves, G. & Lange, J. Seed amplification assay as a diagnostic tool in newly-diagnosed Parkinson’s disease. J. Parkinsons Dis.13, 841–844 (2023). - PMC - PubMed
    1. Concha-Marambio, L., Pritzkow, S., Shahnawaz, M., Farris, C. M. & Soto, C. Seed amplification assay for the detection of pathologic alpha-synuclein aggregates in cerebrospinal fluid. Nat. Protoc.18, 1179–1196 (2023). - PMC - PubMed

LinkOut - more resources