. 2025 Nov;28(11):2392-2401.
doi: 10.1038/s41593-025-02073-3. Epub 2025 Oct 14.

Region-specific drivers of CSF mobility measured with MRI in humans

Affiliations

Region-specific drivers of CSF mobility measured with MRI in humans

Lydiane Hirschler et al. Nat Neurosci. 2025 Nov.

Abstract

Many neurological diseases are characterized by the accumulation of toxic proteins in the brain. This accumulation has been associated with improper clearance from the parenchyma. Recent discoveries highlighted perivascular spaces, which are cerebrospinal fluid (CSF)-filled spaces, as the channels of brain clearance. The forces driving CSF mobility within perivascular spaces are still debated. Here we present a noninvasive, CSF-specific magnetic resonance imaging technique (CSF-Selective T2-prepared REadout with Acceleration and Mobility-encoding) that enables detailed in vivo measurement of CSF mobility in humans, down to the level of perivascular spaces located around penetrating vessels, which is close to protein production sites. We find region-specific drivers of CSF mobility and demonstrate that CSF mobility can be increased by entraining vasomotion. Furthermore, we find region-specific CSF mobility alterations in patients with cerebral amyloid angiopathy, a brain disorder associated with clearance impairment. The availability of this technique opens up avenues to investigate the impact of CSF-mediated clearance in neurodegeneration and sleep.


Conflict of interest statement

Competing interests: The LUMC receives research support from Philips. M.W.A.C. is a shareholder of Nicolab International Ltd. K.D. and D.P. are co-founders and shareholders of relios.vision GmbH. D.P. is on the Guerbet advisory board. The other authors declare no competing interests.

Figures

Fig. 1
Fig. 1. CSF signal and CSF mobility characteristics using CSF-STREAM.
a,b, CSF signal, measured using the non-motion-sensitized reference scan, in the SAS around the MCA (a) and in PVS around penetrating vessels in one representative individual (b). c,d, Principal orientation of CSF mobility in the SAS around the MCA (c), including a zoomed area on one branch, and in PVS of penetrating vessels (d); c,d are from the same ROIs as a and b. The line colors reflect the orientation of CSF mobility: red indicates a left-to-right orientation, green an anterior-posterior orientation and blue a head-to-feet orientation. e,f, Volume rendering of a CSF mobility map (in mm2 s−1) (e) and an FA map in one representative individual (f).
Fig. 2
Fig. 2. Regional CSF mobility and FA using CSF-STREAM.
a, Example of the location of the ROIs in one representative individual: SAS around the MCA, fourth ventricle, CSF around the visual cortex, SAS of the motor cortex sulci, PVS in the BG and PVS surrounding the penetrating vessels. In each insert, the extracted volume rendering of the ROI is shown (top) next to the CSF mobility (in mm2 s−1) volume rendering within the ROI (bottom). b, Average CSF mobility (in mm2 s−1) (left) and FA (right) in the different ROIs in 11 individuals. Each point represents the average value over the voxels in each ROI per individual (one color per individual). In each box plot, the central line indicates the median, and the bottom and top edges of the box indicate the 25th and 75th percentiles, respectively. The whiskers extend to the most extreme data points not considered outliers; outliers are plotted individually using the ‘+’ marker symbol. Source data
Fig. 3
Fig. 3. Change in CSF mobility across driving forces in large CSF spaces around the circle of Willis.
a, Anatomical location and inserts of the CSF signals corresponding to b and c. b, Maps of change in CSF mobility from the mean value over phases (%) across the cardiac (top), respiratory (middle) and random (bottom) cycles in one representative individual. c, Voxel-wise CSF mobility changes in three ROIs shown in the bottom insert in a. Each colored line represents the signal of an individual voxel within the ROI; the thicker line represents the mean value over the voxels in that ROI and the shaded area the confidence interval (CI) over the voxels. Source data
Fig. 4
Fig. 4. Change in CSF mobility across driving forces in PVS around penetrating vessels.
a, Maps of change in CSF mobility from the mean value over phases (%) across the cardiac (top), respiratory (middle) and random (bottom) cycles in one representative individual. b, Voxel-wise changes in CSF mobility in three ROIs shown in the insert. Each colored line represents the signal of an individual voxel within the ROI; the thick line represents the mean value over the voxels in that ROI and the shaded area the CI over the voxels. Source data
Fig. 5
Fig. 5. Regional comparison of change in CSF mobility across driving forces.
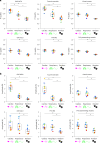
a,b, Change in CSF mobility from the mean value over phases (%) across the cardiac cycle (pink) (a), respiratory cycle (green) (b) and random cycle (gray) (a,b) in six ROIs in 11 individuals. Note that the y axis range is different for the ROI of the fourth ventricle. Each line represents the mean over individuals; the shaded error areas represent the CIs of s.d. × 1.96 (√n)−1 (n = 11). Source data
Fig. 6
Fig. 6. Regional comparison of CSF mobility voxel-wise fit quality and amplitude change across driving forces.
a,b, Comparison between the effect of the cardiac, respiratory and random binning on the fit quality (a) and amplitude (b) of the change in CSF mobility (%) in 11 individuals. Note that the y axis range is different for the fourth ventricle and SAS sulci ROIs in b. Each data point represents the value per individual in an ROI. The single asterisks indicate significant differences with P < 0.01 using a two-sided Wilcoxon signed-rank test applied when a Friedman test was significant. In each box plot, the central line indicates the median and the bottom and top edges of the box indicate the 25th and 75th percentiles, respectively. The whiskers extend to the most extreme data points not considered outliers; the outliers are plotted individually using the ‘+’ marker symbol. Source data
Fig. 7
Fig. 7. Effects of entrained vasomotion on CSF mobility and comparison to other driving forces.
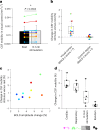
a, Average ± s.d. × 1.96 (√n)−1 CSF mobility (in mm2 s−1) at rest (black) and in the presence (gray) of a 0.1-Hz visual stimulation to entrain vasomotion in nine individuals. Each color represents the value in one individual. The asterisk indicates significant (P = 0.004) changes between the two conditions using a two-sided Wilcoxon signed-rank test. b, Change in CSF mobility (%) induced by the 0.1-Hz visual stimulation compared to rest in the visual cortex (defined as the region where the BOLD z-score was > 7) and in a control region (where the BOLD z-score was < 1) in nine individuals. c, Change in CSF mobility (%) in the visual cortex versus the BOLD amplitude change (%) in nine individuals. d, Change in CSF mobility (%) induced by different driving forces (cardiac, respiratory, visual stimulation and random) in six individuals who participated in both studies. In each box plot, the central line indicates the median and the bottom and top edges of the box indicate the 25th and 75th percentiles, respectively. The whiskers extend to the most extreme data points not considered outliers; the outliers are plotted individually using the ‘+’ marker symbol. Source data
Fig. 8
Fig. 8. CSF-STREAM in patients with CAA versus healthy controls.
a, Example of a 1-mm CSF rim in the SAS around the MCA. b, CSF mobility was significantly increased (P = 0.01, two-sided Mann–Whitney U-test). c, FA was significantly decreased (P = 0.02, two-sided Mann–Whitney U-test) in the 1-mm-thick SAS around the MCA of patients with CAA (pink) versus healthy controls (black). d, ROI volume around the MCA in controls and patients with CAA (P = 0.72, two-sided Mann–Whitney U-test). e, Example of PVS segmentation around penetrating vessels in the CSO. f,g, No significant change in CSF mobility (P = 0.88, two-sided Mann–Whitney U-test) (f) nor FA (P = 0.80, two-sided Mann–Whitney U-test) (g) was found in PVS. h, The PVS volume was significantly increased (P = 0.007, two-sided Mann–Whitney U-test) in patients with CAA. Each data point represents the value per individual (n = 8 controls and n = 8 patients with CAA) in an ROI. In each box plot, the central line indicates the median and the bottom and top edges of the box indicate the 25th and 75th percentiles, respectively. The whiskers extend to the most extreme data points not considered outliers; the outliers are plotted individually using the ‘+’ marker symbol. NS, not significant. Source data
Extended Data Fig. 1
Extended Data Fig. 1. Mean signal intensity in different regions of interest.
Average signal intensity (in a.u.) measured on the non-motion-sensitized reference scan in eight regions of interest of eleven individuals. Each point represents the average value over voxels in each ROI per individual (one color per individual). On each boxplot, the central line indicates the median, and the bottom and top edges of the box indicate the 25th and 75th percentiles, respectively. The whiskers extend to the most extreme data points not considered outliers, and the outliers are plotted individually using the ‘+‘ marker symbol. Source data
Extended Data Fig. 2
Extended Data Fig. 2. Sequence diagram of one CSF-STREAM sub-scan.
Example of the first and last turbo-spin-echo (TSE)-shots. The whole subscan consists of 93 TSE-shots containing each 146 k-lines. Each TSE-shot is preceded by a T2-preparation in which motion-sensitizing gradients can be added to encode CSF mobility. In total, a CSF-STREAM scan consists of seven subscans: one without motion-sensitizing gradients and six with gradients applied in different, orthogonal directions. In this figure, motion-sensitizing gradients are applied in the read and phase directions.
Extended Data Fig. 3
Extended Data Fig. 3. Retrospective binning.
Schematic representation of the binning in cardiac phases with reference to the T2-preparation preceding each turbo-spin-echo (TSE)-shot. This scheme only represents 3 out of the 93 shots. The retrospective binning in 6 phases is performed in two steps: k-space is binned twice in 3 phases, with a 1/6th phase shift between the two steps. The T2-preparation preceding each TSE-shot is taken as reference and the signal in the subsequent TSE-shot is considered to be dependent on this specific cardiac phase.
Extended Data Fig. 4
Extended Data Fig. 4. Regional comparison of fractional anisotropy change across driving forces.
FA change from the mean value over phases (in %) across (A) the cardiac cycle (pink), (B) respiratory cycle (green) and (A&B) random phases (grey) in six regions of interest in eleven individuals. Each line represents the mean over individuals and the shaded error areas represent confidence intervals of SD×1.96/√n (n = 11). Source data
Extended Data Fig. 5
Extended Data Fig. 5. Voxel-wise fit.
(A) Percentage of voxels showing coherent CSF mobility changes across phases (that is R2 > 0.5 when fitting a sinusoidal model) relative to the total amount of voxels in the ROI, in eleven individuals. Values are shown for cardiac (left), respiratory (middle) and random binning (right) in six ROIs. Each datapoint represents the value per individual in a region of interest. On each boxplot, the central line indicates the median, and the bottom and top edges of the box indicate the 25th and 75th percentiles, respectively. The whiskers extend to the most extreme data points not considered outliers, and the outliers are plotted individually using the ‘+‘ marker symbol. (B) Example of the voxel-wise sinusoidal fit (full line, in red) applied to the signal across phases (black dashed line with dots) in three different voxels. The associated fit quality and amplitude are shown above each graph. In the most right panel, the reported amplitude would have be 12%, even though the fit quality to the sinusoid is very low (R2 = 0.22, the corresponding fit is the red dashed line) and does not represent well the CSF mobility change over phases. In that case, an amplitude of 0 is reported instead, as shown by the flat red line to better represent the absence of coupling. Source data
Extended Data Fig. 6
Extended Data Fig. 6. CSF mobility, FA and ROI volume as a function of the distance to the middle cerebral artery (MCA).
(A) Example of dilations around the middle cerebral artery of 1 mm (magenta), 2 mm (green) and 3 mm (blue) containing CSF. (B) CSF mobility, (C) FA and (D) ROI volume across dilation width in CAA patients (pink, dashed line) and healthy controls (black, full line). Each line represents the mean over individuals and the shaded error areas represent confidence intervals of SD×1.96/√n (n = 8 per group). Source data

References

    1. Dolgin, E. Brain’s drain. Nat. Biotechnol.38, 258–262 (2020). - PubMed
    1. Rasmussen, M. K., Mestre, H. & Nedergaard, M. Fluid transport in the brain. Physiol. Rev.102, 1025–1151 (2022). - PMC - PubMed
    1. Iliff, J. J. et al. A paravascular pathway facilitates CSF flow through the brain parenchyma and the clearance of interstitial solutes, including amyloid β. Sci. Transl. Med.4, 147ra111 (2012). - PMC - PubMed
    1. Mestre, H. et al. Flow of cerebrospinal fluid is driven by arterial pulsations and is reduced in hypertension. Nat. Commun.9, 4878 (2018). - PMC - PubMed
    1. van Veluw, S. J. et al. Vasomotion as a driving force for paravascular clearance in the awake mouse brain. Neuron105, 549–561 (2020). - PMC - PubMed

LinkOut - more resources