. 2025 Oct 14;24(1):258.
doi: 10.1186/s12943-025-02480-x.

Reversal of tumour immune evasion via enhanced MHC-Class-I antigen presentation by a dual-functional RNA regulated system

Affiliations

Reversal of tumour immune evasion via enhanced MHC-Class-I antigen presentation by a dual-functional RNA regulated system

Chaoyang Meng et al. Mol Cancer. .

Abstract

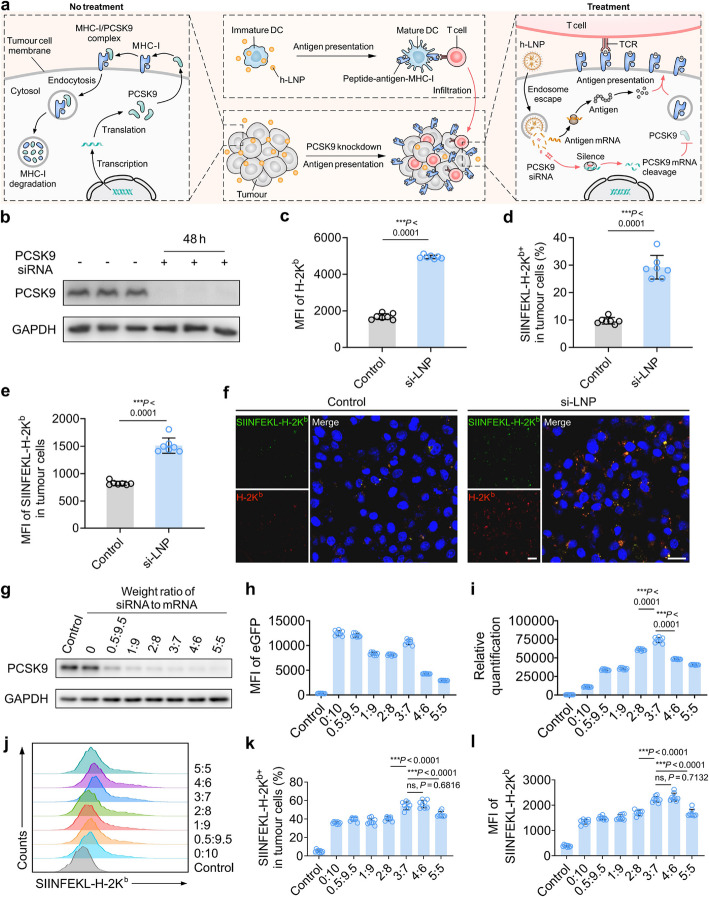
Background: Motivating the immune system to target tumour cells plays an increasingly prominent role in the treatment of hepatocellular carcinoma (HCC), but challenges such as low overall response rates persist in current clinical practice. Tumour cell MHC-Class-I (MHC-I) downregulation and antigen loss are typical mechanisms of immune evasion. To this end, a dual-functional RNA-based strategy was conceived for HCC immunotherapy.

Methods: MHC-I expression on HCC and paratumour tissues from patients was assessed, and the correlations between MHC-I regulators and HCC prognosis were analyzed. Small interfering RNA (siRNA) targeting proprotein convertase subtilisin/kexin type 9 (PCSK9) and mRNA encoding tumour antigens were encapsulated in a fluorinated lipid nanoparticle (LNP), which direct nucleic acids primarily to the liver, making it ideal for HCC treatment. Anti-tumour efficacy was investigated in an orthotopic HCC model, with single-cell RNA sequencing used for in-depth analysis of the tumour microenvironment (TME).

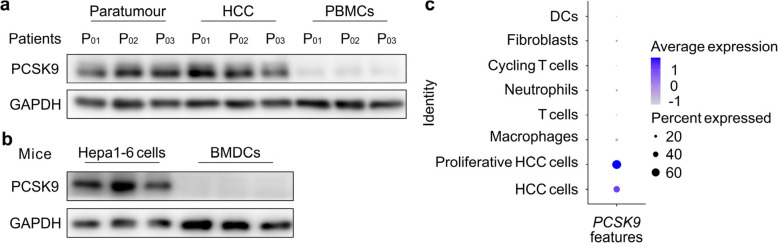
Results: A marked downregulation of MHC-I expression was observed in HCC tumour cells from a cohort of patients, with this MHC-I suppression correlating with poor prognosis and diminished responsiveness to immunotherapy. Among the various MHC-I regulators, PCSK9 is the only one that shows a significant correlation with the prognosis of HCC patients. Knockdown of PCSK9 inhibited MHC-I degradation and thus increased the efficiency of antigen presentation by up to sixfold compared to untreated tumour cells. The hybrid RNA LNPs (h-LNP) enhanced Th1-mediated immune responses, reinvigorating and expanding anti-tumour immunity within the TME. Following treatment with h-LNPs, the TME showed a pronounced infiltration of CD8+ T cells and NK cells, coupled with a significant reduction in immune-suppressive populations, such as M2-like macrophages, in contrast to the controls. These changes in the immune landscape were accompanied by a marked inhibition of tumour growth in an orthotopic HCC model as well as melanoma, where this dual-functional RNA-regulated system outperformed the control groups.

Conclusions: The present study successfully engineered a dual-functional RNA-regulated system that augments tumour cell antigen presentation and reconfigures the immune landscape within the TME, thereby potentiating the anti-tumour efficacy of the mRNA vaccine.

Keywords: Drug delivery; Hepatocellular carcinoma; RNA vaccine; Tumour immunotherapy.


Conflict of interest statement

Declarations. Ethics approval and consent to participate: The study adhered to the ethical principles outlined in the Declaration of Helsinki and received approval from the Clinical Ethics Committee of the First Affiliated Hospital, Zhejiang University School of Medicine (2022–161). All animal studies followed the protocols approved by the Institutional Animal Care and Use Committee at The First Affiliated Hospital, Zhejiang University School of Medicine (2023–536). Every procedure complied the ethical regulations. Consent for publication: All authors consent to the publication. Competing interests: The authors declare no competing interests.

Figures

Fig. 1
Fig. 1
The correlation between MHC-I gene expression and prognosis as well as immunotherapy responsiveness. a Representative immunofluorescence exhibiting HLA-ABC in paratumoural and HCC tissue. Scale bar of 50 μm. b Fluorescence quantitative analysis on HLA-ABC in paratumoural and HCC tissues. n = 48. Paired t test was performed for statistical analysis. c, d Scatterplot showing Pearson's correlation between the integrated density of HLA-ABC immunofluorescence and DFS (c), and between integrated density and OS (d), n = 44. e, f Kaplan–Meier plots of DFS (e) and OS (f) for HLA-ABC low and high group. g The integrated density of HLA-ABC immunofluorescence in non-responders (n = 9) and responders (n = 5) who received ICI therapy. h Tumour growth curve of PBS, non-Responders and Responders group. n = 10. Subcutaneous HCC tumour model was established with Hepa1-6-OVA cells. Mice received PBS or m-LNP treatment when tumour reached ~ 100 mm3 and vaccination was repeated 4 days later. i, j Scatterplot showing Pearson's correlation between the tumour volume and H-2Kb expression (i) as well as between tumour volume and SIINFEKL-H-2Kb levels in tumour cells detected by flow cytometry (j), n = 20. k, l H-2Kb expression (k) and SIINFEKL-H-2Kb levels in tumour cells (l) were compared between non-Responders and Responders group. n = 10. Data are expressed as mean ± s.d. Statistical significance was calculated through an unpaired Student’s t-test or one-way ANOVA with Tukey’s HSD post hoc test. *P < 0.05, **P < 0.01, ***P < 0.001, ns, no significant difference
Fig. 2
Fig. 2
Schematic and characteristics of PCSK9 knockdown to enhance MHC-I expression and epitope presentation in tumour cells. a Schematic illustrating: PCSK9 mediated MHC-I degradation, PCSK9 knockdown elevating MHC-I level and epitope presentation, antigen encoding mRNA activating antigen specific T cells and promoting T cells infiltration into tumours. b Western blotting showing PCSK9 siRNA knockdown efficiency. Hepa1-6-OVA cells were incubated with PCSK9 siRNA encapsulated in LNP (si-LNP) for 48 h. Nonsense siRNA encapsulated in LNP as control. c MFI of H-2Kb in Hepa1-6-OVA cells. n = 7. d Percent of SIINFEKL-H-2Kb+ cells in Hepa1-6-OVA cells. n = 7. e MFI of SIINFEKL-H-2Kb in Hepa1-6-OVA cells. n = 7. f Representative confocal images of Hepa1-6-OVA cells stained with anti-H-2Kb (Red) and anti-SIINFEKL-H-2Kb (Green) antibodies after PCSK9 si-LNP or nonsense si-LNP treatment. Scale bar, 20 μm. g Western blotting showing PCSK9 knockdown efficiency by hybrid nucleic acid LNP (h-LNP). Hepa1-6-OVA cells were co-incubated with h-LNP for 48 h. h-LNP encapsulated different weight ratio of PCSK9 siRNA and eGFP mRNA. h MFI of eGFP in Hepa1-6-OVA cells treated with different h-LNPs formulations. n = 8. i Ratio of eGFP MFI to PCSK9 integrated density. n = 8. j Representative plots from flow cytometry indicating SIINFEKL-H-2Kb in Hepa1-6-OVA cells. k Percent of SIINFEKL-H-2Kb+ cells in Hepa1-6-OVA cells. n = 8. l MFI of SIINFEKL-H-2Kb in Hepa1-6-OVA cells. n = 8. Data are showed as mean ± s.d. An unpaired Student’s t-test was performed for two-group comparison, while one-way ANOVA with Tukey’s HSD post hoc test was employed for comparisons among three or more groups. *P < 0.05, **P < 0.01. ***P < 0.001
Fig. 3
Fig. 3
h-LNP treatment improves MHC-I expression and antigen presentation by tumour cells and induces immune responses. a, b Flow cytometry analysis of SIINFEKL-H-2Kb+ cells on Hepa1-6-OVA tumours. The results were gated on CD45 cells. c Representative immunofluorescence (IF) sections exhibiting H-2Kb+ and SIINFEKL-H-2Kb+ cells in tumours. Scale bar, 20 μm. d, e Flow cytometry analysis of SIINFEKL-H-2Kb in macrophages and CD11c+ DCs from tumours. f, g Flow cytometry analysis of T cells in spleens and TdLNs. Data are presented as mean ± s.d. n = 5. One-way ANOVA with Tukey’s HSD post hoc test was employed for comparisons among three or more groups *P < 0.05, **P < 0.01. ***P < 0.001
Fig. 4
Fig. 4
Distribution of PCSK9 expression. a PCSK9 expression in paratumour, tumour, and PBMCs from patients with HCC. b PCSK9 expression in mouse HCC cell line (Hepa1-6) and BMDCs. c PCSK9 expression profiling in tumour analyzed through sc-RNA seq (Extended data Fig. 1)
Fig. 5
Fig. 5
h-LNP treatment retards tumour growth. a Schematic illustrating the therapeutic strategy. b, c Kinetics of Hepa1-6-OVA tumour growth in h-LNP treatment group and controls. n = 10. d Hepa1-6-OVA tumour weight in different groups on day 13. n = 10. e Hepa1-6-OVA tumours dissected from each group after 13 days. f Kinetics of B16-OVA tumour growth in h-LNP treatment group and controls. n = 7. The P value in orange color refers to the comparison between si-LNP and m-LNP group. The P value in red color refers to the comparison between si-LNP and h-LNP group. g Kaplan–Meier plots of B16-OVA bearing mice survival for h-LNP treatment group and controls. n = 7. Data are presented as mean ± s.d. An unpaired Student’s t-test was performed for two-group comparison, while one-way ANOVA with Tukey’s HSD post hoc test was employed for comparisons among three or more groups. Survival analysis was performed via log-rank test. *P < 0.05, **P < 0.01. ***P < 0.001
Fig. 6
Fig. 6
h-LNP treatment reprograms immune microenvironment in tumour. Hepa1-6-OVA tumour bearing mice received h-LNP or controls through intratumoural injection when tumour volume reached ~ 100 mm3. Vaccination or controls was repeated 4 days after first treatment. Tumours were dissected and analyzed 4 days after second vaccination. n = 5. a-d Quantification of CD45+ cells (a), CD3+ T cells (b) in tumour tissue, CD4+ in T cells (c), CD8+ in T cells (d). e Representative IF images showing CD4+/CD8+ cells in tumours. f Representative plots from flow cytometry and statistical result indicating IFN-γ secreting CD8+ T cells. g scRNA-seq analysis identified immune sub-populations. Dot plots showing gene expression profiles across immune cell types was presented. h UMAP plot illustrating clustering of immune cell subsets. i, Ratio of immune cell sub-populations analyzed through scRNA-seq. j, Gene expression profiles associated with proliferation and cytotoxicity in T cells and NK cells. Data are presented as mean ± s.d. One-way ANOVA with Tukey’s HSD post hoc test was employed for comparisons among three or more groups. *P < 0.05, **P < 0.01. ***P < 0.001
Fig. 7
Fig. 7
Differentiation trajectories and function analysis on the populations of macrophages-1 and macrophages-2 identified by scRNA-seq. a, b Pseudotime-ordered analysis on monocytes, monocyte-like macrophages, macrophages-1 and macrophages-2. c The differences in the functions of macrophages-1 and macrophages-2 detected by differentially expressed gene (DEG) analysis. d M1 scores for macrophages-1 and macrophages-2 cells. e M2 scores for macrophages-1 and macrophages-2 cells. Statistical significance was calculated through an unpaired student’s t test. ***P < 0.001 (Extended data of Fig. 2)
Fig. 8
Fig. 8
TREM2 expression analyzed by scRNA-seq. a TREM2 expression levels in monocyte/macrophages. b TREM2 expression levels among different groups
Fig. 9
Fig. 9
h-LNP treatment induces anti-tumour response and prolongs orthotopic tumour bearing mice survival. a Schematic illustrating the therapeutic strategy. b PET-CT for orthotopic tumour bearing mice in different groups 8 days after tumour inoculation. c Kaplan–Meier plots of orthotopic Hepa1-6-OVA tumour bearing mice survival for h-LNP treatment group and controls. n = 8. d Body weight of mice after treatment. n = 8. e–g Quantification of SIINFEKL-H-2Kb+ in Hepa1-6-OVA cells (e), CD4+ in T cells (f), and CD8+ in T cells (g), n = 5. h Flow cytometry analysis showing the ratio of CD8+ T cells to CD4+ T cells, n = 5. i Flow cytometry analysis showing IFN-γ+ secreting CD8+ T cells. n = 5. Data are presented as mean ± s.d. One-way ANOVA with Tukey’s HSD post hoc test was employed for comparisons among three or more groups. Survival analysis was performed via log-rank test. *P < 0.05, **P < 0.01. ***P < 0.001

References

    1. Khan AA, Liu ZK, Xu X. Recent advances in immunotherapy for hepatocellular carcinoma. Hepatobiliary Pancreat Dis Int. 2021;20:511–20. - PubMed
    1. Reig M, et al. BCLC strategy for prognosis prediction and treatment recommendation: the 2022 update. J Hepatol. 2022;76:681–93. - PMC - PubMed
    1. Li Z, et al. Analysis of efficacy and safety for the combination of regorafenib and PD-1 inhibitor in advanced hepatocellular carcinoma: a real-world clinical study. iLIVER. 2024;3:100092. 10.1016/j.iliver.2024.100092 - PMC - PubMed
    1. Lyon AR, Yousaf N, Battisti NML, Moslehi J, Larkin J. Immune checkpoint inhibitors and cardiovascular toxicity. Lancet Oncol. 2018;19:e447–58. - PubMed
    1. Lee MS, et al. Atezolizumab with or without bevacizumab in unresectable hepatocellular carcinoma (GO30140): an open-label, multicentre, phase 1b study. Lancet Oncol. 2020;21:808–20. - PubMed

MeSH terms

Substances