. 2025 Sep 29:16:1642527.
doi: 10.3389/fimmu.2025.1642527. eCollection 2025.

A flexible systems analysis pipeline for elucidating spatial relationships in the tumor microenvironment linked with cellular phenotypes and patient-level features

Affiliations

A flexible systems analysis pipeline for elucidating spatial relationships in the tumor microenvironment linked with cellular phenotypes and patient-level features

Gabriel F Hanson et al. Front Immunol. .

Abstract

Introduction: Quantitative investigation of how the spatial organization of cells within the tumor microenvironment associates with disease progression, patient outcomes, and that cell's phenotypic state remains a key challenge in cancer biology. High-dimensional multiplexed imaging offers an opportunity to explore these relationships at single-cell resolution.

Methods: We developed a computational pipeline to quantify and analyze the neighborhood profiles of individual cells in multiplexed immunofluorescence images. The pipeline characterizes spatial co-localization patterns within the tumor microenvironment and applies interpretable supervised machine learning models, specifically orthogonal partial least squares analysis (OPLS), to identify spatial relationships predictive of cell states and clinical phenotypes.

Results: We applied this framework to a previously published non-small cell lung cancer (NSCLC) cohort across four applications. At the cellular level, we identified neighborhood features associated with lymphocyte activation states. At the tumor-immune interface, we demonstrated that the immune cell composition surrounding major histocompatibility complex class I-expressing (MHC I+) tumor cells could distinguish adenocarcinoma from squamous cell carcinoma. At the patient level, spatial features predicted tumor grade.

Discussion: By integrating cell-segmented imaging data with interpretable modeling, our pipeline reveals key spatial determinants of tumor biology. These findings generate testable mechanistic hypotheses about intercellular interactions and support the development of spatially informed prognostic and therapeutic strategies.

Keywords: NK cell; T cell; immune interactions; spatial biology; spatial proteomics; supervised machine learning; systems immunology; tumor-immune cell interactions.


Conflict of interest statement

The authors declare that the research was conducted in the absence of any commercial or financial relationships that could be construed as a potential conflict of interest. The author(s) declared that they were an editorial board member of Frontiers, at the time of submission. This had no impact on the peer review process and the final decision.

Figures

Figure 1
Figure 1
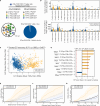
Pipeline overview - Cell ecological feature extraction from mIF data combined with supervised multivariate analysis predicts cellular- and cohort-level phenotypes. Cell segmentation is performed on mIF images and staining positivity is assigned, digitizing the images. Neighborhood profiles are calculated for each cell by quantifying the number of cells of each phenotype at distances relevant for juxtacrine and paracrine signaling. Combinations of immunofluorescent stains are used to assign phenotypes to cells across the images. Bootstrapped Partial least squares analysis identifies spatial relationships between cell types that predict cellular characteristics (e.g., activation) and cohort-level outcomes (e.g., survival, histological type) based on neighborhood profiles. These relationships are validated using univariate approaches. This method is based on the hypothesis that multiplexed spatial proteomic data contain granular, pairwise spatial relationships that, when systematically analyzed, can reveal meaningful patterns of cellular colocalization and function. We analyze spatial data at single-cell resolution by quantifying, for each “center” cell, the number of “neighbor” cells of each phenotype within a defined radius. This process yields a local neighborhood profile for every cell in the tissue, analogous to applying a moving average filter across the spatial domain. Radii are selected to reflect biologically relevant distances for contact-dependent and paracrine signaling.
Figure 2
Figure 2
Neighborhood colocalization transformation creates single cell data with predictive power. (A) Non-transformed count data highlighted in red. (B) Spatial point data is transformed by counting neighbors of a given cellular phenotype within a given radius. This results in a transformation quantifying the pairwise relationships between phenotypes within a radius on a cell-by-cell basis. Transformed neighbor data highlighted in blue. (C) Cross-validation accuracy of predictive models trained to identify which patients had high MHC class I expression on tumor cells based on 3 sets of different input features: non-transformed cell counts data (red), neighborhood-transformed data (blue), or a combination of both (purple). Bars represent one standard deviation around the mean accuracy across bootstraps. (D) Variable importance in projection (VIP) scores from the model that contains a mixture of counts features and neighbor relationships, underscoring the added value of including cellular colocalization, which appear on top of the list. Throughout the manuscript VIP scores are artificially assigned the sign of the loading of that feature on LV1 to visually highlight the group they are higher in. Error bars indicate variability, representing ±1 standard deviation (SD) of model performance across bootstrap iterations, providing a measure of robustness.
Figure 3
Figure 3
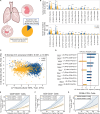
Activated T cells within paracrine-relevant distances best predict IFNγ expression in neighboring immune cells. (A) IFNγ intensity in immune cells (CD3+, CD3-CD56+) serves as a marker of lymphocyte activation. (B) A subset of immune cells was classified as activated based on IFNγ expression. (C) A histogram of IFNγ staining intensity in immune cells reveals the distribution of intensity values. Neighborhood colocalization profiles were calculated for each immune cell, and an OPLS-R model was used to predict IFNγ staining intensity based on these profiles. (D) Scatter plots of X scores show each immune cell as a point in the model. The model achieved a mean squared error of 0.027, a Q² of 0.31, and outperformed all 1,000 models trained on randomly permuted data. (E) Bar plots display VIP scores oriented by their loadings on LV1. All of the top neighborhood score features are associated with higher IFNγ intensity and are colored blue as such. Error bars show ±1 SD around mean across bootstrap iterations. Variables with VIP scores > 1 are shown, indicating above-average influence on group separation.
Figure 4
Figure 4
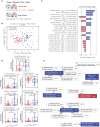
The IFNγ expression of CD8- T cells are closely associated with their paracrine-range neighborhood profile. (A) CD8- T cells were classified based on their IFNγ expression, and an OPLS-DA model was constructed using neighborhood profiles to distinguish between IFNγ+ and IFNγ- cells. Only 1.0% of the CD8- T cell population was IFN-y+ cells. The low proportion of activated CD8- T cells necessitates the application of down-sampling techniques to balance the data in univariate and multivariate analysis. (B) Univariate comparisons revealed significant differences in neighborhood profiles of activated versus inactive CD8- T cells, assessed by a two-sided Mann-Whitney test with Bonferroni correction. * p <0.05, ** p < 0.01, *** p< 1E-6, (- indicates IFNγ-CD8-CD3+ is the larger group, + indicates IFNγ+CD8-CD3+ is larger). (C) OPLS-DA models successfully discriminated CD8- T cells based on IFNγ expression, achieving 88.0% cross-validation (CV) accuracy and outperforming 1,000 random permutations. Scatter plots show X scores, where each point represents a CD8- T cell projected onto latent variables 1 and 2 (LV1 and LV2). (D) Bar plots of VIP scores illustrate key features associated with CD8- T cells of different IFNγ expression statuses. Error bars represent ±1 standard deviation of mean across bootstrap iterations. Variables with VIP score > 1 were identified as having above-average influence on group separation. (E) Iterative down-sampling of center cells resulted in an average model accuracy of 0.88. (F) The model predicted IFNγ expression with an area under the receiver operating curve (AUROC) of 0.97, with a threshold of 0.54 used for classification. (G) The confusion matrix, accumulated over 5-fold CV, demonstrated a model F1 score of 0.90 and precision of 0.91. (E–G) Cross K-function correlation plots illustrate spatial relationships between IFNγ+ CD8- T cells and (E) other IFNγ+ CD8- T cells, (F) IFNγ+ cytotoxic T cells, and (G) IFNγ+ NK cells, across a range of radii. Dashed lines represent 95% confidence intervals, and the black line indicates the Poisson (null) distribution.
Figure 5
Figure 5
The neighborhood profile of MHC I+ PanCK+ cells distinguish their residence within LUAD or LUSC NSCLC tumors. (A) MHC I+PanCK+ cells were identified in LUAD and LUSC tumor regions. Group imbalance motivated the use of down-sampling techniques. (B) Univariate comparisons of neighborhood profiles showed significant differences between LUAD and LUSC patients, determined using a two-sided Mann-Whitney test with Bonferroni correction. * < 0.05, ** < 0.01, *** < 1E-6, (- indicates LUSC is the larger group, + indicates LUAD is larger) (C) An OPLS-DA model discriminated MHC I+ tumor cells based on their neighborhood profiles, achieving 83% cross-validation accuracy and outperforming 1,000 random permutation models (p< 0.001). Scatter plots display X scores, with each point representing a tumor cell projected onto latent variables 1 and 2 (LV1 and LV2). (D) Bar plots of VIP scores highlight features associated with tumor histology. Error bars represent ±1 standard deviation of mean across bootstrap iterations. Variables with |VIP score| > 1 were deemed significant contributors to class separation. (E–G) Cross K-function correlation plots illustrate spatial relationships between IFNγ⁺ CD8⁻ T cells and (E) other IFNγ⁺ CD8⁻ T cells, (F) IFNγ⁺ cytotoxic T cells, and (G) IFNγ⁺ NK cells, across a range of radii. Dashed lines represent 95% confidence intervals, and the black line indicates the Poisson (null) distribution.
Figure 6
Figure 6
High-grade LUAD tumors are enriched for CD8+ T cell infiltration and MHC I expression. (A) ROIs were classified as low-grade or high-grade based on pathologist-defined cancer grades. (B, C) An OPLS-DA model was constructed to distinguish between ROIs from high- or low-grade tumors. The model achieved 76% classification accuracy in 5-fold cross-validation and outperformed all 1,000 randomly permuted models (p< 0.001). (B) Scatter plots of X scores depict each tumor ROI projected onto latent variables. (C) Bar plots of VIP scores highlight features with VIP scores > 1, indicating above-average influence on group separation. Features are artificially oriented by loadings on LV1 and colored based on association with high- or low-grade regions. Grey shading indicates stromal regions, and black shading indicates tumor regions, as defined by a random forest classifier. (D) Boxplots of features with |VIP score| > 1 show significant differences between groups (Mann-Whitney U test, * = p< 0.05). Error bars represent ±1 standard deviation of mean across bootstrap iterations. (E) Correlation networks depict non-LASSO-selected neighborhood features that were significantly correlated (Spearman r > 0.75, p< 0.05) with LASSO-selected features. Connections indicate correlation strength, and circle fill colors denote group enrichment. White outlines indicate LASSO-removed features. LV, latent variable; VIP, variable importance in projection.

References

    1. Heindl A, Nawaz S, Yuan Y. Mapping spatial heterogeneity in the tumor microenvironment: A new era for digital pathology. Lab Investig. (2015) 95:377–84. doi: 10.1038/labinvest.2014.155, PMID: - DOI - PubMed
    1. Grivennikov SI, Greten FR, Karin M. Immunity, inflammation, and cancer. Cell. (2010) 140:883–99. doi: 10.1016/j.cell.2010.01.025, PMID: - DOI - PMC - PubMed
    1. Finn OJ. Cancer immunology. N Engl J Med. (2008) 358:2704—2715. doi: 10.1056/NEJMra072739, PMID: - DOI - PubMed
    1. Wu M-Y, Lu J-H. Autophagy and macrophage functions: inflammatory response and phagocytosis. Cells. (2020) 9:70. Available online at: https://www.mdpi.com/2073-4409/9/1/70. - PMC - PubMed
    1. Daneshpour H, Youk H. Modeling cell–cell communication for immune systems across space and time. Curr Opin Syst Biol. (2019) 18:44–52. doi: 10.1016/j.coisb.2019.10.008, PMID: - DOI - PMC - PubMed

MeSH terms