. 2025 Oct 15;135(20):e194243.
doi: 10.1172/JCI194243.

Cancer-associated fibroblasts enhance colorectal cancer lymphatic metastasis via CLEC11A/LGR5-mediated WNT pathway activation

Affiliations

Cancer-associated fibroblasts enhance colorectal cancer lymphatic metastasis via CLEC11A/LGR5-mediated WNT pathway activation

Chuhan Zhang et al. J Clin Invest. .

Abstract

Hypoxia in the tumor microenvironment promotes lymphatic metastasis, yet the role of cancer-associated fibroblasts (CAFs) in this process remains insufficiently elucidated in colorectal cancer (CRC). In this study, we developed a large language model-based cellular hypoxia-predicting classifier to identify hypoxic CAFs (HCAFs) at single-cell resolution. Our findings revealed that HCAFs enhance CRC lymphatic metastasis by secreting CLEC11A, a protein that binds to the LGR5 receptor on tumor cells, subsequently activating the WNT/β-catenin signaling pathway. This promotes epithelial-mesenchymal transition and lymphangiogenesis, facilitating the spread of tumor cells via the lymphatic system. Furthermore, we demonstrate that the hypoxia-induced transcription factor HIF1A regulates the conversion of normoxic CAFs to HCAFs, driving CLEC11A expression and promoting metastasis. In vivo and vitro experiments confirmed the pro-metastatic role of CLEC11A in CRC, with its inhibition reducing lymphatic metastasis. This effect was markedly reversed by targeting the LGR5 receptor on tumor cells or inhibiting the WNT/β-catenin pathway, further elucidating the underlying mechanisms of CLEC11A-driven metastasis. These findings underscore the potential of targeting the CLEC11A-LGR5 axis to prevent lymphatic dissemination in CRC. Our study highlights the role of HCAFs in CRC progression and reveals mechanisms of lymphatic metastasis for intervention.

Keywords: Bioinformatics; Colorectal cancer; Gastroenterology; Machine learning; Oncology.


Figures
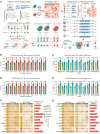
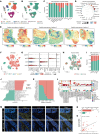
Figure 1
Figure 1. Construction and validation of the CHPC based on the LLM.
(A) Overview of the CHPC based on the LLM. DEGs, differentially expressed genes; ssGSEA, single-sample gene set enrichment analysis. (BE) Differences in accuracy (B) and AUROC (D) between the 2 matrices across varying test set sizes, as well as accuracy (C) and AUROC (E) across different machine-learning models. (F and G) Differences in accuracy (F) and AUROC (G) between the 2 matrices across various machine-learning models and datasets when using 10% of the training data. XGBoost, eXtreme Gradient Boosting; SVM, Support Vector Machine; RF, Random Forest; NB, Naive Bayes; MLP, Multilayer Perceptron; LR, Logistic Regression; LightGBM, Light Gradient Boosting Machine; GBM, Gradient Boosting Machine; DT, Decision Tree; CatBoost, Categorical Boosting. All data are presented as means ± SEM. *P < 0.05, **P < 0.01, ****P < 0.0001; by distribution type, normally distributed data were analyzed using paired t test, whereas non-normally distributed data were examined by Wilcoxon’s signed-rank test (BE).
Figure 2
Figure 2. HCAFs interact strongly with tumor cells and are linked to lymphangiogenesis.
(A) Dimensionality reduction plot showing the distribution of 9 major cell types. (B) Dimensionality reduction plot showing the distribution of the hypoxia status. UMAP, uniform manifold approximation and projection. (C) Stacked bar charts depicting the distribution of hypoxic and normoxic cells across major cell types, epithelial cells, and different tissues. (D) Intercellular communication network between malignant epithelial (EpiT) and other cells. (E) Spatial transcriptomics revealing the spatial proximity between HCAFs and EpiT. (F) Dimensionality reduction plot depicting the distribution of 4 CAF subtypes, including mCAFs, iCAFs, apCAFs, and pCAFs. (G) Dot plot showing the expression of classical CAF-type markers across identified cell populations. (H) Dimensionality reduction plot showing the distribution of the hypoxia status in classical CAF types. (I) Stacked bar charts depicting the distribution of hypoxic and normoxic cells across 4 CAF types. (J) Functional enrichment analysis of HCAFs and NCAFs. (K) Bar plots displaying the relative information flow of differential signaling pathways between HCAFs and NCAFs. (L) Prediction of ligand–receptor interactions between HCAFs, NCAFs, and other cells. (M) mIHC revealing the spatial relationships among HIF-1α, α-SMA, LYVE1, and EPCAM. Scale bar: 50 μm. (N) Box plot illustrating the distribution of HCAF proportions across different N stages (n = 20). (O) Correlation analysis showing a positive correlation between the number of HCAFs and lymphatic vessel density. All data are presented as means ± SEM. **P < 0.01, by Mann-Whitney U test (N) and Spearman’s rank correlation test (O).
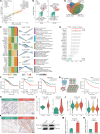
Figure 3
Figure 3. CLEC11A secreted by HCAFs is associated with poor prognosis and lymphatic metastasis.
(A) Volcano plot displaying differentially expressed genes (DEGs) between HCAFs and NCAFs. (B) Volcano plot of DEGs between normal and tumor tissues from TCGA-CRC (left) and CPTAC datasets (right). (C) Mfuzz analysis revealing different gene expression patterns dependent on lymph node stages. The left panel shows the gene expression heatmap, the middle shows gene expression curves, and the right shows the results of pathway enrichment analysis. (D) Venn diagram of upregulated genes in HCAFs, tumor upregulated genes, and genes in the cluster 5. (E) Univariate Cox plot of the 22 shared genes. TMA, tissue microarray cohort. (F and G) Kaplan-Meier survival curve from independent CRC transcriptome datasets (F) and proteomic tissue microarray cohorts (n = 90) (G), indicating the poorer overall survival in patients with high CLEC11A expression. (H) Representative images of IHC staining for CLEC11A in CRC tissues. (I) Violin plots displaying CLEC11A expression levels in CRC tissues from 2 independent transcriptomes. (J) Violin plots displaying CLEC11A expression levels in different lymph node stages from 2 independent CRC transcriptomes. (K) IHC staining of CLEC11A in CRC tissues with and without lymph node metastasis. (L) WB analysis showing the expression levels of CLEC11A in HCAFs and NCAFs. (M) RT-qPCR analysis of CLEC11A mRNA levels in HCAFs and NCAFs (n = 4 per group). (N) ELISA quantification of CLEC11A levels in HCAFs and NCAFs (n = 4 per group). Scale bars: 50 μm (H and K). All data are presented as means ± SEM. **P < 0.01, ****P < 0.0001, by empirical Bayes moderated t test with Benjamini-Hochberg correction (AC), Wald’s test (E), log-rank test (F and G), Student’s t test (M, N, and I; GSE77953), Mann-Whitney U test (I; TCGA-CRC), Kruskal-Wallis test (J; GSE41258), and 1-way ANOVA (J; TCGA-CRC).
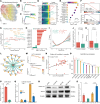
Figure 4
Figure 4. Hypoxia-activated HIF1A in CAFs transcriptionally enhanced the expression of CLEC11A.
(AC) VECTOR (A) and Monocle (B and C) analyses of the transition from NCAFs to HCAFs. UMAP, uniform manifold approximation and projection. (D) Changes in gene expression (left) and pathway activity correlation (right) along Monocle pseudotime. (E) Gene Ontology Biological Process enrichment analysis of pseudotime-associated genes. (F) Gene set enrichment analysis revealed the association of pseudotime-associated genes related to hypoxia and EMT pathways. NES, normalized enrichment score. (G) GeneSwitches analysis identifying key transcription factors involved in the transition from NCAFs to HCAFs. TFs, transcription factors. (H) Significant (P value < 0.05) differences in transcription factor activity between NCAFs and HCAFs. (I) HIF1A regulon activity, expression, and pseudotime correlation. (J and K) Box plot showing differences in HIF1A regulatory specificity (J) and expression (K) between NCAFs and HCAFs. (L) The downstream target gene network of HIF1A. (M) Expression dynamics of HIF1A and CLEC11A along Monocle pseudotime. (N and O) Correlation of HIF1A and CLEC11A in single-cell (N) and bulk transcriptomic datasets (O). (P) ChIP-qPCR analysis showing significant enrichment of HIF1A at the promoter region of CLEC11A (n = 4 per group). (Q) Luciferase assay showing that HIF1A enhances WT over mutant CLEC11A promoter activity (n = 4 per group). (R) WB analysis of CLEC11A and HIF1A protein levels in CAFs. (S) RT-qPCR analysis of CLEC11A mRNA levels in CAFs (n = 4 per group). All data are presented as means ± SEM. **P < 0.01, ***P < 0.001, ****P < 0.0001, by Spearman’s rank correlation test (D, I, and O), Pearson’s correlation test (N), hypergeometric test with Benjamini-Hochberg correction (E), permutation test with Benjamini-Hochberg correction (F), empirical Bayes moderated t test with Benjamini-Hochberg correction (H), Mann-Whitney U test (J, K, and P), and 1-way ANOVA with Tukey’s post test (Q and S).
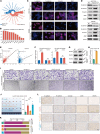
Figure 5
Figure 5. CLEC11A promotes lymphangiogenesis and metastasis in vivo.
(A) Schematic diagram of popliteal lymph node metastasis model establishment in nude mice. (B) Representative images of popliteal lymph node metastasis in a nude mouse model. (C and D) Representative bioluminescence images (C) and bioluminescence quantification (D) of popliteal lymph node metastasis in the mouse model (n = 5 per group). (E and F) Representative images of the mouse popliteal lymph node metastasis model generated using specific CAFs and SW480 (E) or HCT116 (F) cell treatment. Histograms quantifying lymph node volumes (mm³) in nude mice (n = 5 per group). (G) Lymph node metastasis rates in nude mice inoculated with specific CAFs and SW480 (left) or HCT116 (right) cells (n = 15 per group). (H and I) Representative images (H) of anti-LYVE1 staining in plantar tumor tissues. and histogram (I) showing the ratio of LYVE1-positive lymphatic vessels (n = 3 per group). (J) IHC with anti–cytokeratin 20 (CK20) antibody and H&E staining was performed on the CLEC11A overexpression group and CLEC11A knockdown group, showing representative images of the popliteal lymph nodes. Scale bars: 100 μm (H), 50 μm (J, right), 500 μm (J, left and middle). All data are presented as means ± SEM. *P < 0.05, **P < 0.01, ***P < 0.001, ****P < 0.0001, by 1-way ANOVA with Tukey’s post test (DF and I) and χ2 test (G).
Figure 6
Figure 6. CLEC11A promotes lymphatic vessel abnormalities and lymphangiogenesis in vitro in a tumor cell–dependent manner.
(A and B) Representative images (left) and quantification (right) of HLEC migration (A) and tube formation assays (B) (n = 3 per group). (C) Experimental grouping under different conditions and representative phalloidin/DAPI staining images of HLECs. (D) WB analysis of VE-cadherin in HLECs cultured in conditioned medium of CRC cell line with different treatments. (E and F) Representative images (E) and quantitative analysis (F) of HLEC migration (top), tube formation (middle), and SW480/HCT116 cell transendothelial migration (bottom) in coculture with HLECs using CRC cell line–conditioned media under different treatment conditions (n = 3 per group). Scale bars: 100 μm (A, B, and E), 50 μm (C). All data are presented as means ± SEM. *P < 0.05, **P < 0.01, by 1-way ANOVA (A and B) and Student’s t test (F).
Figure 7
Figure 7. CLEC11A promotes EMT and VEGFC production in tumor cells, leading to lymphangiogenesis and lymphatic metastasis.
(A) CLEC11A showing a strong association with EMT pathway activity in both single-cell and bulk datasets. (B) CLEC11A expression showing the significant correlation with EMT-related genes (P < 0.05) in the TCGA-CRC dataset. (C and D) Immunofluorescence (C) and WB (D) analysis of EMT-related genes in CRC cell lines treated with rhCLEC11A. (E) Correlation plot showing positive associations between CLEC11A and VEGFC/VEGFD gene expression in the TCGA-CRC dataset. (F) RT-qPCR analysis of VEGFC and VEGFD expression in SW480 and HCT116 cells treated with rhCLEC11A (n = 4 per group). (G) WB analysis of VEGFC expression in SW480 and HCT116 cells treated with rhCLEC11A. (H) ELISA quantification of VEGFC levels in HCT116 cells treated with rhCLEC11A (n = 4 per group). (I) Representative images of HLEC migration (top) and tube formation (bottom) assays cultured in conditioned media under specific treatments. (J) Representative images of popliteal lymph nodes from the mouse metastasis model established using HCT116 cells coinjected with CAFs subjected to specific treatments. Histograms quantify lymph node volumes (mm³) in nude mice (n = 6 per group). (K) Ratio of metastasis to total dissected lymph nodes in mice inoculated with specific CAFs and HCT116 cells (n = 15 per group). (L) IHC staining of E-cadherin, N-cadherin, Vimentin, ZEB1, and VEGFC. Scale bars: 20 μm (C), 100 μm (I), 200 μm (L). All data are presented as means ± SEM. *P < 0.05, ***P < 0.001, ****P < 0.0001, by Spearman’s rank correlation test (A, B, and E), Welch’s t test (F and H), 1-way ANOVA with Tukey’s post test (J), and χ2 test (K).
Figure 8
Figure 8. CLEC11A promotes lymphangiogenesis and lymphatic metastasis through its interaction with LGR5 on tumor cells.
(A) Identification of ligand-receptor pairs and a schematic of the TimeCCI pipeline, illustrating the calculation of Spearman’s correlation coefficients (SCC) for covarying ligand-receptor pairs between HCAFs and tumor cells. (B) CLEC11A-LGR5 is the top ligand-receptor pair, with the highest SCC among CLEC11A interactions. (C) Normalized interaction probabilities between CLEC11A and its receptors across different cell types. (D) ST data showing CLEC11A-LGR5 interactions. (E) Molecular dynamics simulation of the CLEC11A-LGR5 complex, with structural visualization of key interacting residues. (F) mIHC revealing spatial colocalization between CLEC11A and LGR5. Scale bar: 50 μm. (G) Co-IP confirmed the physical interaction between CLEC11A and LGR5 in SW480 cells.
Figure 9
Figure 9. CLEC11A promotes EMT and VEGFC secretion of tumor cells through the interaction with LGR5 to activate the WNT/β-catenin pathway.
(A) Volcano plot displaying differentially expressed genes (DEGs) between SW480 CRC cells treated with either PBS or rhCLEC11A. (B) Gene Ontology enrichment analysis of DEGs highlighting significant enrichment in the WNT signaling pathway. (C) Correlation analysis showing a positive association between CLEC11A expression and WNT pathway scores in the TCGA-CRC cohort. (D) Bar plots depicting correlations between CLEC11A expression and WNT-related genes in the TCGA-CRC cohort. (E) Representative images of HLEC migration (top) and tube formation (bottom) after culture with HCT116 cell line–conditioned media under different treatments. (F) WB analysis of LGR5, β-catenin, VEGFC, ZEB1, N-cadherin, E-cadherin, and Vimentin protein expression in HCT116 or SW480 cells treated with rhCLEC11A, sh-LGR5, or KYA1797K. (G) Representative images (top) and quantification (bottom left) (n = 6 per group) of popliteal metastatic lymph node volume in mice models generated using HCT116 cells and CAFs subjected to specific treatments. Metastasis rates and the ratio of metastatic to total dissected lymph nodes are shown (bottom right) (n = 15 per group). (H) Representative images (top) and quantification (bottom left) (n = 6 per group) of popliteal metastatic lymph node volume in mice models generated using SW480 cells and CAFs subjected to specific treatments. Metastasis rates and the ratio of metastatic to total dissected lymph nodes are shown (bottom right) (n = 15 per group). (I) IHC staining for protein expression of E-cadherin, N-cadherin, Vimentin, ZEB1, VEGFC, and β-catenin. Scale bars: 100 μm (E), 20 μm (I). All data are presented as means ± SEM. ***P < 0.001, ****P < 0.0001, by empirical Bayes moderated t test with Benjamini-Hochberg correction (A), hypergeometric test with Benjamini-Hochberg correction (B), Spearman’s rank correlation test (C and D), 1-way ANOVA with Tukey’s post test (G and H, bottom left), and χ2 test (G and H, bottom right).

References

    1. Bray F, et al. Global cancer statistics 2022: GLOBOCAN estimates of incidence and mortality worldwide for 36 cancers in 185 countries. CA Cancer J Clin. 2024;74(3):229–263. - PubMed
    1. Gupta GP, Massagué J. Cancer metastasis: building a framework. Cell. 2006;127(4):679–695. doi: 10.1016/j.cell.2006.11.001. - DOI - PubMed
    1. Biller LH, Schrag D. Diagnosis and treatment of metastatic colorectal cancer: a review. JAMA. 2021;325(7):669–685. doi: 10.1001/jama.2021.0106. - DOI - PubMed
    1. Pepper MS. Lymphangiogenesis and tumor metastasis: myth or reality? Clin Cancer Res. 2001;7(3):462–468. - PubMed
    1. Compton CC, Greene FL. The staging of colorectal cancer: 2004 and beyond. CA Cancer J Clin. 2004;54(6):295–308. - PubMed

MeSH terms