. 2025 Oct 15;16(1):9159.
doi: 10.1038/s41467-025-64169-5.

Genome-wide CRISPR Screen Identifies Sec31A as a Key Regulator of Alpha Cell Survival

Affiliations

Genome-wide CRISPR Screen Identifies Sec31A as a Key Regulator of Alpha Cell Survival

Kimitaka Shibue et al. Nat Commun. .

Abstract

Glucagon, secreted by pancreatic alpha cells, is essential for maintaining normal blood glucose levels. In type 1 and advanced type 2 diabetes, alpha cells often fail to respond to low glucose, yet the mechanisms underlying their stress resistance remain unclear. To investigate this, we performed a genome-wide CRISPR screen and identify Sec31A, a gene involved in transporting proteins from the endoplasmic reticulum (ER), as a key regulator of alpha cell survival under stress. We show that loss of Sec31A enhances survival in stressed mouse alpha cells and in C. elegans. In human islets, SEC31A expression increases in alpha cells under inflammatory stress, and this upregulation is reversed by reducing ER stress. Functional studies in lab-grown human islet clusters reveal distinct responses in alpha versus beta cells following Sec31A suppression. We also find that Sec31A interacts with the insulin receptor, suggesting a link between stress adaptation and insulin signaling in alpha cells.


Conflict of interest statement

Competing interests: R.N.K. serves on the Scientific Advisory Boards of Novo Nordisk, Biomea and REDD Pharmaceuticals. The other authors declare no competing interests.

Figures

Fig. 1
Fig. 1. Genome-wide CRISPR screen in alpha cells.
A Overview of the CRISPR screen and subsequent next-generation sequencing (NGS) of enriched guide RNAs (gRNAs). B Representative images (left) and dose-dependent survival curve (right) of alphaTC6 cells after treatment with TG (0, 10, 50, and 100 nM) for seven days. Scale bar: 400 µm. Four biological replicates cultured in independent wells were examined. Data are presented as mean values ± SEM. C Principal component analysis (PCA) of NGS data. PCA plot showing the variance of each group of samples. D Heatmap showing log 2 count per million (cpm) of enriched gRNAs in the survived cells after the treatment with TG (0, 50, 100, 150 and 250 nM). E Volcano plot (shown in log2 fold change) of enriched gRNAs in the control cells versus survived cells in 250 nM TG. F Gene Ontology Analysis of the top enriched gRNAs in Fig. 1E. For panels (E, F), differential expression analysis was performed using limma, applying a one-sided moderated t test to compare drug-treated (250 nM TG) and control groups for genes with increased expression. P-values were adjusted for multiple comparisons using the Benjamini–Hochberg method to control the false discovery rate. G Interactive Pathway analysis of the top 50 proteins which gRNAs were enriched in the group of 250 nM TG treatment. H Transcription factor (TF) enrichment analysis of the top genes whose gRNAs were enriched in the group receiving 250 nM TG treatment. Enrichment was assessed by a one-sided Fisher’s exact test, with p-values adjusted for multiple comparisons using the Benjamini–Hochberg FDR method. Bar heights indicate –log₁₀(raw P-values). Source data are provided as a Source Data file.
Fig. 2
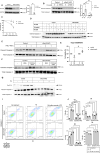
Fig. 2. AlphaSec31AKD cells show survival phenotype against ER stress.
A Generation of alphaSec31A KD cells. Left: Immunoblots of control cells and alphaSec31A cells. Quantification is shown in the right panel. Data are presented as mean values ± SEM. (two-tailed Student’s t test). **p < 0.01. Three biological replicates cultured in independent wells were examined. B Immunoblots of control and αSec31A knockdown cells treated with thapsigargin (TG, 1 μM) for 5 h. Quantified band intensities are presented as mean ± SEM. One-way ANOVA revealed a significant overall difference among groups (p = 0.0001), and Tukey’s post-hoc test was used to assess pairwise significance.*p < 0.05, **p < 0.01. Four biological replicates cultured in independent wells were examined. C Cell viability assays of control and alphaSec31A cells. n = 6 (0 h, 48 h), n = 4 (63 h), each representing an independent biological replicate. Data are presented as mean values ± SEM. (two-tailed Student’s t test). *p < 0.05. D Immunoblots of cleaved caspase-3 after treating control and alphaSec31A cells with thapsigargin (TG), tunicamycin (Tm), and Brefeldin A (BA) for 5 h. Figure E, F Immunoblots of control and αSec31A cells treated with TNFα (1000 U/ml) and IFN-γ (1000 U/ml) (E) or palmitate (500 μM) for 16 h (F). G Immunoblots of control and siRNA-mediated Sec31A knockdown cells treated with TG (1 μM) for 5 h. H Cell viability of control and αSec31A KD cells after concentration-dependent H₂O₂ treatment (n = 3, each an independent biological replicate). Data are presented as mean values ± SEM. (two-tailed Student’s t test). *p < 0.05. I, J Flow cytometric analysis of apoptosis in control and αSec31A knockdown cells treated with thapsigargin (TG, 1 μM for 5 h) and following 24 h of TG removal (n = 3 independent biological replicates). I Representative quadrant dot plots (J) Quantification of cell populations across quadrants (Q1–Q4) under control, TG, and post-TG recovery conditions. Data are presented as mean ± SEM. Two-way ANOVA revealed significant main and/or interaction effects, and Tukey’s post-hoc test was applied to assess pairwise differences. *p  <  0.05, **p  <  0.01,***p  <  0.001. Data are presented as mean values ± SEM. Source data are provided as a Source Data file.
Fig. 3
Fig. 3. Sec31A inhibition induces a protective organismal response against ER stress.
A UPRER stress response in C. elegans assessed by the transcriptional reporter hsp-4p::GFP and qualitative quantified by GFP intensity. B Bright field (BF) and GFP microscopy images of hsp-4p::GFP worms grown under COPII inhibition by KD of sec-23 and sec-31. Scale bar, 100 μm. C Quantification of the hsp-4 transcriptional response after RNAi against sec-31 (See Supplementary Data 4  for details). D Knockdown of sec-31 allowed a greater UPRER transcriptional response when subjected to ER stress by tunicamycin. Scale bar, 100 μm. E Quantification of biological replicates shown in (D). Data in (C, D) were analyzed using a two-sided Chi-square test to compare the frequency of fluorescent signal distribution between groups. No adjustments were made for multiple comparisons. F COPII inhibition by sec-31 KD allowed greater survival under ER stress conditions (see Supplementary Table 1 for survival details, replicates, and statistics). Numbers above bars denote sample size (biological replicates), **p < 0.01, ***p < 0.001. Source data are provided as a Source Data file.
Fig. 4
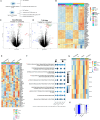
Fig. 4. Mitigation of SEC Gene Expression Under ER Stress in Type 1 Diabetes Islets.
A Human islets sourced from non-diabetic (non-DM) and Type 1 Diabetes (T1D) donors, incubated for 24 h in Miami medium, with or without the addition of thapsigargin (TG) at a concentration of 250 nM. Created in BioRender. Shibue, K. (2025) https://BioRender.com/7w1qe08. B Heatmap representing the log2 (fold change) of the top differentially expressed genes (DEGs) after TG treatment in non-DM and T1D islets, alongside the SEC family genes originally identified in the CRISPR screen (as depicted in Fig. 1). C, D Volcano plot of genes in non-DM (C) and T1D (D) islets treated with TG. Differential gene expression was assessed using limma with moderated two-sided t tests. Equivalence testing for unchanged genes (fold change < 20%) was performed using two one-sided t tests (TOST). P-values were adjusted for multiple comparisons using the Benjamini-Hochberg FDR correction. E Heatmap of T1D islets treated with TG, TUDCA, and their mixture. Donor numbers (5–7) in the figure correspond to those in Fig. 4B and Supplementary Table 2. F Dot plots of ER stress-related pathways in T1D islets treated with TG, TUDCA, and their mixture. Differential expression was analyzed using limma with linear modeling and moderated two-sided t tests. P-values were adjusted for multiple testing using the Benjamini-Hochberg FDR method. G Gene expressions of SEC family genes, including SEC31A, in T1D islets treated with TG, TUDCA, and their mixture. N = 3 for T1D, each representing an independent biological replicate. Donor numbers (5–7) correspond to those in Fig. 4B and Supplementary Table 2. H SEC31A expression levels expressed as log2 CPM under control (no treatment), TG, TUDCA, and TG + TUDCA conditions (blue shading reflects expression level: darker blue = higher expression, lighter blue = lower expression). I Immunohistochemistry of non-diabetic human islets treated with media containing TNFα (1000 U/ml), IFN-γ (1000 U/ml), IL-1β (50 U/ml) + IFNγ, and 19 mM glucose was stained with antibodies against insulin (INS), glucagon (GCG), and SEC31A. Treatment time was 24 h. N = 3, each representing an independent biological replicate. Scale:20 μm. For the demographics of donors, see Supplementary Table 2. J Quantification of SEC31A-positive cells shown in (I). Data is presented as mean values ± SEM. (two-tailed Student’s t test). *p < 0.05. Source data are provided as a Source Data file.
Fig. 5
Fig. 5. Molecular analyses of human islet cells with SEC31A knock down.
A Human alpha and beta cells sorted from cadaveric human islets were incubated in Miami media for seven days to generate pseudoislets. Created in BioRender. Shibue, K. (2025) https://BioRender.com/x9b8puh. B, C qPCR results showing SEC31A expression between control and SEC31AKD alpha (B) and beta (C) pseudoislets. Biological replicates, n = 4 for alpha cells and n = 3 for beta cells, each representing an independent biological replicate. Data are presented as mean values ± SEM. Two-tailed Student’s t test; *p < 0.05. D, E Representative images of control and SEC31AKD alpha pseudoislets (D) and beta pseudoislets (E). F, G Volcano plots comparing control and SEC31AKD alpha pseudoislets (F) and beta pseudoislets (G). Differential expression was analyzed using limma with linear modeling and moderated two-sided t tests, incorporating surrogate variables as covariates. FDR was controlled using the Benjamini-Hochberg method. H Heatmap of selected genes up-regulated in SEC31AKD alpha pseudoislets. Biological replicates, n = 4 for alpha cells and n = 2 for beta cells, each representing an independent biological replicate. I, J STRING analysis of the functional protein-protein interaction network of up-regulated genes in SEC31AKD alpha pseudoislets (n = 4, each representing an independent biological replicate)(I) and beta pseudoislets (n = 2, each representing an independent biological replicate)(J). K, L Enriched GO term analyses showing significantly up-regulated genes in SEC31A-KD alpha pseudoislets (n = 4, each representing an independent biological replicate) (K) and beta pseudoislets (n = 2, each representing an independent biological replicate)(L). Source data are provided as a Source Data file.
Fig. 6
Fig. 6. Sec31A cross talks with proteins in insulin/IGF1 signaling pathway.
A Co-immunoprecipitation of IRβ and Sec31A in alphaTC6 cells. Immunoblots of Sec31A in cell lysates that were immunoprecipitated with IRβ and Sec31A. B AlphaSe31AKD cells exhibited enhanced phosphorylation of insulin signaling pathways, independent of glucose concentration. Cells were treated with 100 nM insulin for 15 min following overnight starvation in DMEM containing either 5.5 mM or 25 mM glucose. The right panel displays the quantification of p-IR/IR and p-IRS1/IRS1 in the presence of 25 mM glucose. Data are presented as mean values ± SEM. (two-tailed Student’s t test). *p < 0.05, **p < 0.01. Three biological replicates cultured in independent wells were examined. C Repression of TG-induced cleaved caspase-3 elevation in alphaSec31A cells was not observed when TG was administered with OSI-906. Immunoblots of cleaved caspase-3 in control and alphaSec31A cells treated with/without TG and OSI-906. D Immunoblots of TCPTP in control and alphaSec31A cells after the treatment with TG. Quantification is shown in the lower panel. Data are presented as mean values ± SEM. (two-tailed Student’s t test). *p < 0.05. Six biological replicates cultured in independent wells were examined. Source data are provided as a Source Data file.

References

    1. ElSayed, N. A. et al. 2. Classification and diagnosis of diabetes: standards of care in diabetes-2023. Diabetes Care46, S19–S40 (2023). - PMC - PubMed
    1. Reno, C. M. et al. Severe hypoglycemia-induced sudden death is mediated by both cardiac arrhythmias and seizures. Am. J. Physiol.Endocrinol. Metab.315, E240–E249 (2018). - PMC - PubMed
    1. Hitt, T. A. et al. The impact of fear of hypoglycaemia on sleep in adolescents with type 1 diabetes. Diabet. Med.40, e15066 (2023). - PMC - PubMed
    1. Hædersdal, S., Andersen, A., Knop, F. K. & Vilsbøll, T. Revisiting the role of glucagon in health, diabetes mellitus and other metabolic diseases. Nat. Rev. Endocrinol. 19, 321–335 (2023). - PubMed
    1. Omar-Hmeadi, M., Lund, P.-E., Gandasi, N. R., Tengholm, A. & Barg, S. Paracrine control of α-cell glucagon exocytosis is compromised in human type-2 diabetes. Nat. Commun.11, 1896 (2020). - PMC - PubMed

MeSH terms

LinkOut - more resources