. 2025 Oct 15;16(1):9154.
doi: 10.1038/s41467-025-64168-6.

Low circulating miR-190a-5p predicts progression of chronic kidney disease

Affiliations

Low circulating miR-190a-5p predicts progression of chronic kidney disease

David P Baird et al. Nat Commun. .

Abstract

MicroRNAs may act as diagnostic and prognostic biomarkers of chronic kidney disease and are functionally important in disease pathogenesis. To identify novel microRNA biomarkers, we performed small RNA-sequencing on plasma from individuals with type 2 diabetes, with and without chronic kidney disease. MiR-190a-5p abundance was significantly lower in the circulation of type 2 diabetic patients with reduced function compared to those with normal kidney function. In an independent cohort of patients with chronic kidney disease of diverse aetiology, miR-190a-5p abundance predicted disease progression in individuals with no or moderate albuminuria ( < 300 mg/mmol). miR-190a-5p expression in kidney biopsy tissue correlated with the level of miR-190a-5p in the circulation and with estimated glomerular filtration rate, tubular mass and negatively with histological fibrosis. Administration of a miR-190a-5p mimic in a murine ischaemia-reperfusion injury model in male mice reduced tubular injury and fibrosis and increased expression of genes associated with tubular health. Our analyses suggest that miR-190a-5p is a biomarker of tubular cell health, low circulating levels may predict chronic kidney disease progression independent of existing risk factors and strategies to preserve miR-190a-5p may be an effective treatment for restoring tubular cell health following kidney injury.


Conflict of interest statement

Competing interests: These authors declare no competing interests: J.Z., K.L.C., O.T., R.K.Y.W., M.R., C.C., J.P.T., J.H., A.P.M., G.J.M., D.A.S. and L.D. These authors declare the following competing interests: P.B.M. reports lecture or advisory board honoraria from AstraZeneca, Bayer, Boehringer Ingelheim, Pharmacosmos, Astellas, Vifor, GSK and research funding from AstraZeneca and Boehringer Ingelheim outside the submitted work. B.R.C. reports consultancy from Argenx and research funding from AstraZeneca outside the submitted work. D.P.B. is listed as a co-inventor on a patent application covering urinary protein biomarkers in chronic kidney disease outside the submitted work.

Figures
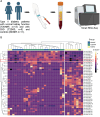
Fig. 1
Fig. 1. Identification of miR-190a-5p as a differentially expressed circulating biomarker in T2D patients with normal and kidney disease.
A Schematic of the experimental approach to identify differentially expressed circulating miRNAs in patients with Type II diabetes with and without kidney disease compared to age-matched controls. BioRender. Denby, L. (2025) https://BioRender.com/z8pwjvsB Heatmap representation of the unsupervised clustering of miRs with an FDR < 0.1 in any comparison (n = 45) from the unbiased small RNA sequencing of plasma of patients with type 2 diabetes and kidney disease (T2DKD, n = 9), type 2 diabetes, with normal renal function (T2DNRF, n = 13) or non-diabetic controls with normal renal function (NDNRF, n = 11). Each column represents a sample, each row a miRNA, and the colour the relative expression (z score). Red box highlights miR-190a-5p.
Fig. 2
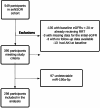
Fig. 2. Flowchart of patients from the seNSOR study cohort who were included and excluded from the analysis of miR-190a-5p as a potential biomarker.
From the 549 participants in the seNSOR cohort, patients were excluded who were already receiving, or close to requiring RRT (eGFR of < 20 ml/min/1.73 m2 at recruitment). Patients with missing data or acute kidney injury at baseline were also excluded. From the 395 participants meeting the study criteria, miR-190a-5p was not detected in the serum from 97 patient samples. Analysis was performed in the remaining 298 participants. RRT – renal replacement therapy.
Fig. 3
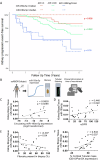
Fig. 3. miR-190a-5p expression predicts kidney disease progression in patients with low to moderate proteinuria and is reduced in kidney tissue in patients with declining kidney function.
A Kaplan-Meier survival curve for progression of kidney disease. Patients within the seNSOR cohort were segregated into groups by severity of albuminuria and whether serum miR-190a-5p levels were above (dashed line) or below (solid line) the median value. ACR: urinary albumin:creatinine ratio. The Log-rank test was used to compare curves. B Schemata of human CKD biopsy tissue being processed for quantification of miR-190a-5p expression, fibrosis, tubular mass by CD10/PanCK staining, and linked to clinical data. Created in BioRender. Denby, L. (2025) https://BioRender.com/ee0461g (CF) miR-190a-5p in renal biopsy tissue from patients within the seNSOR cohort correlates with (C). miR-190a-5p transcript abundance in the circulation (n = 14 paired samples). For the determination of linear correlation between variables, correlation coefficients (r) were generated using Pearson’s test. Circulating miR-190a-5p expression was log-transformed before entering the model due to non-normal distribution (D). kidney function as determined by eGFR (n = 26 biopsy samples). Analysed by Pearson’s correlation (E), negatively with percentage fibrosis (n = 25 biopsy samples). Analysed by Pearson’s correlation (F), tubular mass as measured by CD10:PanCK staining of biopsy core (n = 24 biopsy samples).
Fig. 4
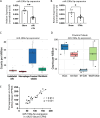
Fig. 4. miR-190a-5p is lost in pre-clinical models of kidney disease and is enriched in proximal tubular cells.
A miR-190a-5p expression was measured by RT-qPCR, normalised to U6 in RNA extracted from kidneys from mice culled 2 weeks after sham (n = 4, male mice) or uIRI surgery with contralateral nephrectomy (Nx, n = 6, male mice). Data are presented as mean normalised expression +/– SEM. Data analysed by Mann-Whitney test. **p = 0.0095 vs sham animals (B) miR-190a-5p expression was measured by RT-qPCR, normalised to U6 in RNA extracted from kidneys from mice culled 12 weeks post sham (n = 5, male) or subtotal nephrectomy (STNx) surgery to induce progressive kidney disease (n = 8, male). Data are presented as mean normalised expression +/− SEM. Data analysed by Mann Whitney test. * p = 0.0186 vs Sham animals. C Expression of miR-190a-5p determined by small RNA-seq performed on cell subsets isolated by FACS from the renal cortex of mice undergoing a reversible ureteric obstruction model. n = 16/cell type. Box (IQR) is the median, Q1 (25th percentile), Q3 (75th percentile). The whiskers represent: Minimum Q1-1.5*IQR and Maximum Q3-1.5*IQR. IQR = Interquartile range. D Small RNA-Seq of sorted cortical proximal tubular cells during the rUUO model. n = 3-4/gp. Box (IQR) is the median, Q1 (25th percentile), Q3 (75th percentile). The whiskers represent: Minimum Q1-1.5*IQR and Maximum Q3-1.5*IQR. IQR = Interquartile range (E). Correlation of miR-190a-5p expression and Tln2 in bulk cortical rUUO tissue. n = 20. Analysed by Pearson’s correlation. FPKM = Fragments Per Kilobase of transcript per Million mapped reads. CPM = Counts per Million.
Fig. 5
Fig. 5. Overexpression of miR-190a-5p in the kidney reduces injury and fibrosis induced by uIRI.
A Schema of the intervention study in which mice were randomly assigned to either receive subcutaneous treatment with miR-190a-5p mimic or control mimic (n = 7/gp) and uIRI surgery. Animals were dosed on 7 occasions (purple arrows) and culled at Day 14 post-surgery. Created in BioRender. Denby, L. (2025) https://BioRender.com/s67k0ep (B) miR-190a-5p expression in the kidney following intervention with miR-190a-5p or control mimic was determined by RT-qPCR from RNA extracted from the IRI kidneys and normalised to U6 (n = 7/group). Data analysed by an unpaired Student’s t test. *p = 0.0167 vs control mimic treated. C RNA extracted from the IRI kidneys at Day 14 was profiled for the expression of genes associated with tubular health and normalised to Ppia (n = 7/group). Data analysed by an unpaired Student’s t test. For Havcr-1 *p = 0.0322; Egf ***p = 0.0002; Ass1 *p = 0.0489 vs control mimic treated. D Gene expression of fibrosis-related transcripts were assessed in RNA extracted from the IRI kidneys at Day 14 and normalised to Ppia (n = 7/group). Data analysed by unpaired Student’s t test. *p = 0.0388 vs control mimic treated. E Fibrosis was semi-quantified by picrosirus red staining of non-overlapping FFPE sections prepared from IRI and sham kidneys at Day 14 (n = 7/group). Staining was quantified using ImageJ. Data analysed by an unpaired Student’s t test. *** p = 0.0003 vs control treated kidney.
Fig. 6
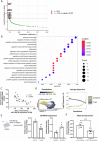
Fig. 6. Identification and validation of ADAM10 as a miR190a-5p target in proximal tubular cells.
A Analysis of potential negatively correlated gene targets of miR-190a-5p ordered by correlation coefficient (r) and –log10(p-value) in PT cells from the rUUO model. r < -0.6, p-value < 0.05. Analysed by Pearson’s correlation. PT = Proximal Tubule (B). Pathway enrichment analysis for negatively correlated miR-190a-5p target genes. C Correlation of Adam10 with miR-190a-5p expression in the renal cortex of the reversible ureteric obstruction (rUUO) model. For the determination of linear correlation between variables, correlation coefficients (r) were generated using Pearson’s test. FPKM = fragments per kilobase mapped. CPM = Counts per million. D PT cells ordered in pseudotime trajectory from healthy to inflammatory cell state in the non-tumorous portion of nephrectomy tissue from patients with and without ureteric obstruction. Right graph. Mean ADAM10 or TLN2 expression in each cell along the pseudotime trajectory. E ADAM10 expression in human proximal tubular cell line (RPTECs) with over-expression (50 nM mimic) or knockdown (100 nM inhibitor) of miR-190a-5p. Data analysed by unpaired Student’s t test. **p = 0.0073 (mimic), *p = 0.0173 (inhibitor) vs scrambled control (n = 3 biological replicates). PT – proximal tubule Created in BioRender. Denby, L. (2025) https://BioRender.com/0ljj331 (F). Adam10 expression in the renal cortex of mice that underwent ischaemia-reperfusion injury and were administered miR-190a-5p mimic or scrambled control (n = 7/group). Data analysed by an unpaired Student’s t test. ***p = 0.0007 vs Control Mimic.

References

    1. GBD Chronic Kidney Disease Collaboration. Global, regional, and national burden of chronic kidney disease, 1990-2017: a systematic analysis for the Global Burden of Disease Study 2017. Lancet395, 709–733 (2020). - PMC - PubMed
    1. Magliano, D. J., Boyko, E. J. IDF Diabetes Atlas. (2021).
    1. GBD 2021 Diabetes Collaborators. Global, regional, and national burden of diabetes from 1990 to 2021, with projections of prevalence to 2050: a systematic analysis for the Global Burden of Disease Study 2021. Lancet402, 203–234 (2023). - PMC - PubMed
    1. UK Renal Registry. UK Renal Registry 25th Annual Report – data to 31/12/2021 B, UK. https://ukkidney.org/audit-research/annual-report (2023).
    1. Johansen, K. L. et al. US Renal Data System 2023 Annual Data Report: Epidemiology of Kidney Disease in the United States. AJKD 83, A8–A13 (2024). - PubMed

MeSH terms

LinkOut - more resources