. 2025 Oct 15;16(1):9156.
doi: 10.1038/s41467-025-64161-z.

Microglia-specific regulation of lipid metabolism in Alzheimer's disease revealed by microglial depletion in 5xFAD Mice

Affiliations

Microglia-specific regulation of lipid metabolism in Alzheimer's disease revealed by microglial depletion in 5xFAD Mice

Ziying Xu et al. Nat Commun. .

Abstract

Abnormal lipid metabolism is observed in Alzheimer's disease (AD), but its contribution to disease progression remains unclear. Genetic studies indicate that microglia, the brain's resident immune cells, influence lipid processing during AD. Here, we show that microglia-the brain's resident immune cells-selectively regulate lipid accumulation that associated with disease pathology in both AD mouse models and human postmortem brains. Using lipidomics and histological analysis, we identify a striking buildup of arachidonic acid-containing bis(monoacylglycero)phosphate in response to amyloid plaques, which depends on microglial activity and the AD risk gene GRN. In contrast, lysophosphatidylcholine and lysophosphatidylethanolamine accumulate independently of microglia, correlating instead with astrocyte activation and oxidative stress. These results connect dysregulated lipid metabolism in AD to distinct brain cell types and molecular pathways. Our findings highlight microglial lipid homeostasis as a potential therapeutic target for modifying disease progression in AD.


Conflict of interest statement

Competing interests: The authors declare no competing interests.

Figures

Fig. 1
Fig. 1. Study design, microglial depletion dynamics and neuropathological outcomes in 5xFAD mice.
A Experimental timeline and interventions. Left: Pharmacological microglial depletion in non-transgenic (Non-Tg) and 5xFAD transgenic mice (mixed B6SJL background) using short-term (2-week) or long-term (3.5 months) treatment. Right: Genetic microglial ablation (FIRE) in 5xFAD mice (B6 background). OSD OpenStandard Diet (Research Diets). Brain samples were collected at indicated time points and analyzed by shotgun lipidomics, NanoString Glial Profiling Panel, and immunofluorescence. Schematic created in BioRender. Xu, Z. (2025) https://BioRender.com/6dlymhx. B–J Pathological characterization after long-term intervention. Representative images and quantifications of microglial marker (P2Y12) (B–D), amyloid beta (Aβ, MOAB-2) (E–G), and astrocytic marker (GFAP) (K–M) immunofluorescence, as well as Methoxy-X04 (H–J) fluorescent staining for fibrillar β-sheet amyloid plaques. Each data point represents a brain section, two sections from 3–4 female mice/group were quantified. BZ-X800 Analyzer auto function was used to set a threshold for each section. Representative images shown at matched magnifications and thresholds. N–P APP and neuronal levels. Western blot analysis of APP using 6E10 antibody and synaptic marker Homer1 (N), with corresponding quantifications displayed in panels (O) and (P), respectively. Each data point represents one animal, n = 4–5 mice/group. Trem2 mRNA quantification in both long-term pharmacological (Q) and (R) genetic cohorts. Each data point represents one animal, n = 4–6 mice/group. All data presented as mean ± SEM. Statistical analysis was performed in GraphPad using one-way ANOVA with Tukey’s post-hoc correction. Representative images (indicated by stars in the corresponding dot plots) were chosen from brain sections present on the same slide, with each slide containing sections from each experimental group. Scale bars: 50 μm for main panels (BK); 20 μm for insets.
Fig. 2
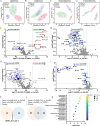
Fig. 2. Disrupted lysosomal metabolism in the brains of microglia-depleted 5xFAD mice revealed by shotgun lipidomics and targeted transcriptomics.
(A–E) Global lipidomics: Partial least squares discriminant analysis (PLS-DA) plots of brain lipidomes in long-term pharmacological (A) and genetic (B) microglial depletion. Each data point represents one animal, n = 5–8 mice/group. Data normalized by log10 transformation and mean scaling. Volcano plots displaying differentially altered lipid species after microglial depletion in long-term pharmacological (C) and genetic (D) interventions. E Venn diagrams showing overlapping lipid species decreased after microglial depletion in amyloidosis conditions. Statistical analysis for lipidomics data was performed in MetaboAnalyst using multiple pairwise t-testing with false discovery rate correction for multiple comparisons (FDR = 0.05; significance threshold q ≤ 0.05). F–K Targeted transcriptomics: PLS-DA plots showing NanoString transcriptomic profiles in long-term pharmacological (F) and genetic (G) microglia-depleted mice. Each data point represents one animal, n = 4–6 mice/group. Volcano plots displaying differentially expressed genes (DEGs) following microglial depletion in long-term pharmacological (H) and genetic (I) interventions. Species and genes with adjusted p-values ≤ 0.05 and log2 fold changes ≥ 0.25 are highlighted in the volcano plots. J Venn diagrams of shared DEGs downregulated after microglial depletion in amyloidosis conditions. K Bubble plot of the top 10 enriched Gene Ontology (GO) terms using the 16 DEGs identified in panel J. Statistical analysis for RNA profiling was performed using nSolver Advanced Analysis default options with Benjamini-Hochberg correction for multiple comparisons.
Fig. 3
Fig. 3. Microglial depletion prevents lysosomal BMP accumulation in 5xFAD mice.
A–D Quantification of specific BMP species levels in human postmortem temporal lobe Brodmann area 38 (BA38): comparison of AD vs non-AD controls. Human data normalized by log10 transformation. Statistical analysis was performed in MetaboAnalyst using metadata table module linear model adjusted for sex and gray/white matter ratio (GWR) with false discovery rate correction for multiple comparisons (FDR = 0.05). E–H Levels of corresponding BMP species in mouse brains following long-term pharmacological microglial depletion. Data normalized by square root transformation and pareto scaling. Statistical analysis was performed in MetaboAnalyst using one-factor module t-testing correcting for multiple comparisons (FDR = 0.05). I–L Levels of same BMP species in mouse brains after genetic microglial depletion. Data normalized by log10 transformation. Statistical analysis was performed in MetaboAnalyst using metadata table module linear model adjusted for sex correcting for multiple comparisons (FDR = 0.05). Heatmaps of lysosomal gene expression after long-term pharmacological (M) and genetic (N) microglial depletion. Significantly altered genes denoted: 5xFAD vs Non-Tg (#), and 5xFAD + PLX5622 vs 5xFAD (*) by two-tailed unpaired t-tests with Benjamini-Hochberg correction. Correlations between relative AA-BMP levels and total lysosome gene counts in microglia-depleted mouse brains following long-term pharmacological (O) and genetic (P) interventions. Statistical analysis was performed in MetaboAnalyst using metadata table module linear model regressing relative AA-BMP levels against all NanoString predefined pathways adjusting for multiple correlations (FDR = 0.05, significance threshold q ≤ 0.05). Each data point represents one animal, n = 4-8 mice/group. All data presented as mean ± SEM.
Fig. 4
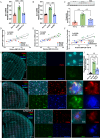
Fig. 4. Microglia-dependent arachidonic acid-containing BMP accumulation in 5xFAD mice correlates with progranulin elevation.
Relative Grn mRNA expression after long-term pharmacological (A) and genetic (B) microglial depletion. Correlation analysis of relative AA-BMP levels with relative Grn mRNA expression in long-term pharmacological (D) and genetic (E) microglial depletion. Relative progranulin protein levels assessed via Western blot (C) were correlated with AA-BMP levels (F). Each data point represents one animal, n = 4-8 mice/group. Statistical analysis was performed in MetaboAnalyst using metadata table module linear model regressing relative AA-BMP levels against all genes with false discovery rate correction for multiple comparisons (FDR = 0.05). Representative immunofluorescence images showing progranulin (PGRN), Iba1 (microglia/macrophages), MOAB-2 (amyloid plaques) and DRAQ5 (nuclei) in non-Tg (G), 5xFAD (H) and 5xFAD + PLX5622 (I). J Quantification of high progranulin intensity, primarily in plaque-associated and activated microglia. Each data point represents a brain section, 1-2 sections from 3 female mice/group were quantified. All data presented as mean ± SEM, normalized to non-Tg controls. Statistical analysis was performed in GraphPad using ordinary one-way ANOVA with Tukey’s post hoc correction.
Fig. 5
Fig. 5. Microglia-independent lysophosphatidylcholine accumulation in 5xFAD mice correlates with astrocytic activation.
Quantification of total lysophosphatidylcholine (LPC) levels in human AD and control brains (A), long-term pharmacological (B) and genetic (C) microglial-depletion cohorts. Data normalized by square root transformation and pareto scaling (A and B), or by cube root transformation and auto scaling (C). Each data point represents one subject, n = 5-10 subjects/group. Statistical analysis was performed in MetaboAnalyst using metadata table module linear model adjusted for sex and GWR with false discovery rate correction for multiple comparisons (FDR = 0.05) (A) and ordinary one-way ANOVA with Tukey’s post hoc correction (B and C) on raw values. D Top three genes significantly correlated with LPC levels in long-term pharmacological (top) and genetic (bottom) microglia-depletion cohorts with false discovery rate correction for multiple comparisons (FDR = 0.05). E Venn diagram showing overlap of genes correlated with LPC levels between cohorts. Correlation plots of LPC levels and NanoString Astrocyte Markers Pathway Scores in long-term pharmacological (F) and genetic (G) microglia-depleted cohorts. Statistical analysis was performed in MetaboAnalyst using multiple linear regressions adjusting for multiple correlations (FDR = 0.05). H Western blot analysis of GFAP protein levels (top) and corresponding quantification (bottom) in the long-term pharmacological cohort. Statistical analysis was performed in GraphPad using ordinary one-way ANOVA with Tukey’s post hoc correction. Each data point represents one animal, n = 5-8 mice/group. I Correlation plot of LPC levels and relative GFAP protein levels in the long-term pharmacological cohort. Statistical analysis was determined using multiple linear regressions with false discovery rate correction for multiple comparisons (FDR = 0.05). Data presented as mean ± SEM.
Fig. 6
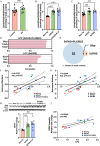
Fig. 6. Persistent lysophosphatidylethanolamine accumulation in 5xFAD mice despite microglial depletion.
A Quantification of total lysophosphatidylethanolamine (LPE) levels in human AD and control brains. Data normalized by square root transformation and pareto scaling. Statistical analysis was performed in MetaboAnalyst using metadata table module linear model adjusting for sex and gray/white matter ratio (GWR). Total LPE levels in long-term pharmacological (B) and genetic (C) microglial-depletion mouse cohorts. Data normalized by square root transformation and pareto scaling (B) or cube root transformation and auto scaling (C). Statistical analysis was performed in GraphPad using ordinary one-way ANOVA with Tukey’s post hoc correction. Each data point represents one subject, n = 5-10 subject/group. D Western blot analysis of Nrf2 protein levels (top) and corresponding quantification (bottom). Each data point represents one animal, n = 5-8 mice/group. E Correlation plots showing negative correlation between LPE and Nrf2 protein levels. NanoString Apoptosis Pathway Scores in long-term pharmacological (F) and genetic (G) microglial-depletion mouse brains. Each data point represents one animal, n = 4-6 mice/group. Statistical significance was determined using ordinary one-way ANOVA with Tukey’s post hoc correction. Data presented as mean ± SEM.
Fig. 7
Fig. 7. Conserved lipidome changes associated with amyloidosis and microglial depletion across pharmacological and genetic mouse models.
This schematic summarizes alterations in major lipid classes observed in mouse brain tissue under amyloid pathology (top brain quadrants) and after microglial depletion (right brain quadrants), consistent across both pharmacological (PLX5622-treated) and genetic (FIRE) cohorts. Insets illustrate key lipid metabolic pathways: lysophosphatidylcholine (LPC), lysophosphatidylethanolamine (LPE), and arachidonic acid-specific bis(monoacylglycero)phosphate (AA-BMP) are increased under amyloidosis; microglial depletion results in decreased AA-BMP. Colors indicate the direction of change (red: increased; blue: decreased). The central diagram illustrates experimental conditions and main pathological/cellular features. Arrows indicate major metabolic pathways—including synthesis and degradation—connecting lipid species. Central brain schematic symbols represent resting microglia, activated microglia, dense core amyloid plaques, and diffuse plaques, as distinguished by their respective shapes and colors. Schematic created in BioRender. Xu, Z. (2025) https://BioRender.com/2ydgf4r.

References

    1. Winblad, B. et al. Defeating Alzheimer’s disease and other dementias: a priority for European science and society. Lancet Neurol.15, 455–532 (2016). - PubMed
    1. Mosher, K. I. & Wyss-Coray, T. Microglial dysfunction in brain aging and Alzheimer’s disease. Biochem Pharm.88, 594–604 (2014). - PMC - PubMed
    1. Udeochu, J. C., Shea, J. M. & Villeda, S. A. Microglia communication: Parallels between aging and Alzheimer’s disease. Clin. Exp. Neuroimmunol.7, 114–125 (2016). - PMC - PubMed
    1. Chen, G. F. et al. Amyloid beta: structure, biology and structure-based therapeutic development. Acta Pharm. Sin.38, 1205–1235 (2017). - PMC - PubMed
    1. Bok, E. et al. Role of the Lipid Membrane and Membrane Proteins in Tau Pathology. Front Cell Dev. Biol.9, 653815 (2021). - PMC - PubMed

LinkOut - more resources