. 2025 Oct 15;16(1):9155.
doi: 10.1038/s41467-025-64185-5.

Piezo1 regulates the mechanotransduction of soft matrix viscoelasticity

Affiliations

Piezo1 regulates the mechanotransduction of soft matrix viscoelasticity

Mariana A G Oliva et al. Nat Commun. .

Abstract

Mechanosensitive ion channels such as Piezo1 have fundamental roles in sensing the mechanical properties of the extracellular matrix. However, whether and how Piezo1 senses time-dependent matrix mechanical properties, that is, viscoelasticity, remains unknown. To address this question, we combine an immortalised mesenchymal stem cell line, in which Piezo1 expression can be silenced, with soft and stiff viscoelastic hydrogels that have independently tuneable elastic and viscous moduli. We demonstrate that Piezo1 is a regulator of the mechanotransduction of viscoelasticity in soft matrices, both experimentally and through simulations incorporating Piezo1 into a modified viscoelastic molecular clutch model. Using RNA sequencing, we also identify the transcriptomic responses of mesenchymal stem cells to matrix viscoelasticity and Piezo1 activity, identifying gene signatures that reflect their mechanobiology in soft and stiff viscoelastic hydrogels.


Conflict of interest statement

Competing interests: The authors declare no competing interests.

Figures
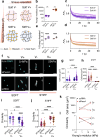
Fig. 1
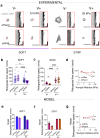
Fig. 1. Cell response to matrix viscoelasticity is stiffness and Piezo1 dependent.
a Representation of the different hydrogel networks. Here and in the other figure panels, V− represents an elastic, slow-relaxing hydrogel and V+, a fast-relaxing, viscoelastic hydrogel. Aam: Acrylamide, BisAam: Bisacrylamide, Linear Aam: Linear Acrylamide. Gel network diagram was created with BioRender b Nanoindentation measurements, showing Young’s modulus data obtained for Soft (0.4 kPa, purple) and Stiff (25 kPa, orange) hydrogel pairs. Data shown as individual values, mean ± SD (from left to right n = 95, 58, 113, 80 single indentation curves, from N ≥ 3 gels). c Representative average stress relaxation curve ± SD of an indentation performed on soft (purple) and d stiff (orange) hydrogels. e Average energy dissipated in soft (purple) and stiff (orange) hydrogel groups, shown as individual values, mean ± SD. From left to right n = 4, 8, 3 and 3 indentations maps, comprising 61, 87, 41 and 71 total indentations on N = 3 hydrogels. f Representative Actin and DAPI immunofluorescence images of control (scRNA) and Piezo1 knock down (siPiezo1) Y201 MSCs cultured on different hydrogel groups for 48 h. Scale bar = 50 µm g, h Quantified cellular area on the soft (left) and stiff (right) hydrogel groups. All individual points represent individual cell measurements. Data shown as individual values, mean ± SD, in (g) from left to right n = 47, 58, 59 and 66 cells; in (h) from left to right n = 62, 42, 40 and 33 cells. Data from N = 3 independent experiments. i, j Quantified cellular circularity of the soft (left) and stiff (right) hydrogel groups. Data shown as individual values, mean ± SD. In (i) from left to right n = 32, 50, 47 and 51 cells; in (j) from left to right n = b 52, 46, 31 and 33 cells. Data from N = 3 independent experiments. k Summary of mean cellular area ± SEM plotted as a function of stiffness for scRNA (black), siPiezo1 (red), V− (continuous line) and V+ (dashed line) conditions. l Summary of mean cellular circularity ± SEM plotted as a function of stiffness for for scRNA (black), siPiezo1 (red), V− (continuous line) and V+ (dashed line) conditions. Statistical analyses were performed using a two-way ANOVA test. P values indicating significance, ns > 0.05, *≤0.05, **≤0.01, ***≤0.001, ****≤0.000. Specific p values and descriptive statistics are provided in the Source Data.
Fig. 2
Fig. 2. Focal adhesion formation in response to matrix viscoelasticity is stiffness and Piezo1-dependent.
a Representative images of immunostained vinculin adhesions in siPiezo1 and scRNA Y201 MSCs cultured on soft (0.4 kPa, left) and stiff (25 kPa, right) hydrogel groups of varying stress relaxation rates. Scale bar = 50 µm, zoomed image scale bar = 5 µm. b, c Quantified individual focal adhesion (FA) length of cells on the soft (left) and stiff (right) hydrogel groups. In (b) from left to right n = 103, 104, 130 and 371 individual FA measurements from 30, 31, 32 and 39 cells; in (c) from left to right n = 689, 1289, 103 and 76 individual FA measurements from 30, 31, 31 and 35 cells. Data from N = 3 independent experiments. Data shown as individual values, mean ± SD. d Summary of mean individual FA length ± SEM plotted as a function of stiffness for scRNA (black), siPiezo1 (red), V− (continuous line) and V+ (dashed line) conditions. Statistical analyses were performed using a two-way ANOVA test. P values indicating significance, ns > 0.05, *≤0.05, ***≤0.001, ****≤0.0001. Specific p values and descriptive statistics are provided in the Source Data. e Schematic of the influence of Piezo1 in molecular clutch engagement. Cell is shown to be coupled to the ECM via ECM-binding integrins that in turn, connect to the contractile actin filaments via mechanosensitive adaptive proteins (talin and vinculin). Myosin motors continuously pull on actin filaments with velocity (v). Here, the ECM is modelled as a Standard Linear Solid (SLS), composed of two elastic springs (K1 and K2) and a viscous dashpot element (η). kon and koff represent the rates of clutch association and dissociation, respectively. In the zoom (grey shading), the concerted action between Piezo1 and integrins is highlighted, showing that potentiation of this interaction decreases clutch dissociation (koff), created with BioRender. f, g Scaled model predictions of focal adhesion length (µm) on the soft (left) and stiff (right) substrate groups. Data shown as individual values, mean ± SD (N = 26 simulations). h Summary of model predictions for mean scaled focal adhesion length (µm) ± SEM plotted as a function of substrate stiffness for scRNA (black), siPiezo1 (red), V− (continuous line) and V+ (dashed line) conditions.
Fig. 3
Fig. 3. Actin retrograde flow in response to matrix viscoelasticity is stiffness and Piezo1-dependent.
a Representative images of LifeAct GFP transfected siPiezo1 and scRNA MSCs cultured on the soft (left) and stiff (right) hydrogel groups. Scale bar = 50 µm. Red insets are kymographs showing the movement of actin features, scale bar = 5 µm (horizontal) and 60 s (vertical). b, c Quantified retrograde flow speed (nm/s) in siPiezo1 and scRNA MSCs cultured on the soft (left) and stiff (right) hydrogel groups. In (b) from left to right n = 29, 29, 38 and 39 individual kymograph measurements from 13, 8, 16 and 9 cells; in (c) from left to right n = 35, 39, 26 and 34 individual kymograph measurements from 12, 16, 13 and 17 cells. Data from N = 2 independent experiments. Data shown as individual values, mean ± SD. d Summary of mean experimental retrograde actin flow speed (nm/s) ± SEM plotted as a function of stiffness for scRNA (black), siPiezo1 (red), V− (continuous line) and V+ (dashed line) conditions. e, f Model predictions of retrograde flow speed (nm/s) of cells on soft (left) and stiff (right) substrates. Data shown as individual values, mean ± SD (N = 26 simulations). g Summary of model predictions of mean retrograde actin flow speed (nm/s) ± SEM plotted as a function of stiffness for scRNA (black), siPiezo1 (red), V− (continuous line) and V+ (dashed line) conditions. Statistical analyses were performed using a two-way ANOVA test. P values indicating significance, ns > 0.05, *≤0.05, ***≤0.001, ****≤0.0001. Specific p values and descriptive statistics are provided in the Source Data.
Fig. 4
Fig. 4. Matrix viscoelasticity and Piezo1 expression regulate downstream mechanotransduction and mitochondrial morphology.
a, b Quantified nuclear spreading area on the soft (left) and stiff (right) hydrogel groups. In (a) from left to right, n = 36, 37, 32 and 38 cells; in (b) from left to right, n = 39, 38, 31 and 35 cells. Data from N = 3 independent experiments. Data shown as individual values, mean ± SD. c Representative images of nuclei (insets) and YAP in siPiezo1 (top) and scRNA Y201 MSCs (bottom) cells on soft (0.4 kPa, left) and stiff (25 kPa, right) hydrogel groups of varying stress relaxation. Scale bar = 50 µm, DAPI inset scale bar = 5 µm. d, e Quantified nuclear over cytoplasmic YAP (nucYAP/cytoYAP) ratio on the soft (left) and stiff (right) hydrogel groups. In (d) from left to right, n = 34, 34, 32 and 38 cells; in (e) from left to right n = 55, 40, 34 and 31 cells from N = 3 independent experiments. Data shown as individual values, mean ± SD. f Summary of mean nuclear spreading area ± SEM plotted as a function of stiffness for all conditions. g Summary of mean nucYAP/cytoYAP ratio ±SEM plotted as a function of stiffness for all conditions. In (f, g) conditions are as follow: scRNA (black), siPiezo1 (red), V− (continuous line) and V+ (dashed line). h Correlation between nucYAP/cytoYAP and nuclear spreading area for all conditions. scRNA conditions have rounded symbols whilst siPiezo1 are squared. Symbol colour indicates stiffness and energy dissipation conditions. Data shown as mean ± SEM. R2 obtained from simple linear regression analysis fitting mean values i Representative images of siPiezo1 (top) and scRNA (bottom) MSCs immunostained for TOMM20 (cyan) and DAPI (magenta) cultured on soft (0.4 kPa, left) and stiff (25 kPa, right) hydrogels for 48 h. Scale bar 50 µm; TOMM20 inset scale bar 2 µm j, k Quantified mean mitochondrial form factor of MSCs cultured on the soft (left) and stiff (right) hydrogel groups. In (j) from left to right, n = 32, 40, 40 and 36 cells; in (k) from left to right, n = 37, 48, 33 and 32 cells. Data from N = 3 independent experiments. l Summary of mean mitochondrial form factor ± SEM plotted as a function of stiffness for all conditions. a, b, d, e, j, k Statistical analyses were performed using a two-way ANOVA test. P values indicating significance, ns > 0.05, *≤0.05, **≤0.01, ***≤0.001, ****≤0.0001. Specific p values and descriptive statistics are provided in the Source Data.
Fig. 5
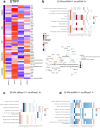
Fig. 5. RNA-seq analysis of siPiezo1 and scRNA Y201 MSCs cultured on stiff elastic (V−) and viscoelastic (V+) matrices.
a Curated z-score (rlog-normalised expression) heatmap of stiff group genes across experimental conditions per defined gene families (Integrins, Actin cytoskeleton, YAP signalling, Mitochondria and Contractility). b (Top) Heatmap of enriched results from Over Representation Analysis (ORA), which overlap with the most DE genes in the scRNA MSC V− vs scRNA MSC V+ comparison. (Bottom) A network of the three top enriched DE gene groups connected by their overlapping genes. c Heatmap of enriched results from ORA that overlap with the most DE genes in the siPiezo1 V− vs siPiezo1 V+ comparison. d Heatmap of enriched results from ORA that overlap with the most DE genes in the scRNA V− vs siPiezo1 V− comparison.
Fig. 6
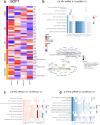
Fig. 6. RNA-seq analysis of siPiezo1 and scRNA Y201 MSCs cultured soft elastic (V−) and viscoelastic (V+) matrices.
a Curated z-score (rlog-normalised expression) heatmap of soft group genes across experimental conditions per defined gene families (Integrins, Actin cytoskeleton, YAP signalling, Mitochondria and Contractility). b (Top) Heatmap of enriched results from Over Representation Analysis (ORA), which overlap with the most DE genes in the scRNA MSC V− vs scRNA MSC V+ comparison. (Bottom) A network of the top enriched DE gene groups connected by their overlapping genes. c Heatmap of enriched results from Gene Set Enrichment Analysis (GSEA) that overlap with the most DE genes in the siPiezo1 V− vs siPiezo1 V+ comparison. d Heatmap of enriched results from ORA that overlap with the most DE genes in the scRNA V− vs siPiezo1 V− comparison.

References

    1. Engler, A. J., Sen, S., Sweeney, H. L. & Discher, D. E. Matrix elasticity directs stem cell lineage specification. Cell126, 677–689 (2006). - PubMed
    1. Lo, C.-M., Wang, H.-B., Dembo, M. & Wang, Y. Cell movement is guided by the rigidity of the substrate. Biophys. J.79, 144–152 (2000). - PMC - PubMed
    1. Novikova, E. A., Raab, M., Discher, D. E. & Storm, C. Persistence-driven durotaxis: generic, directed motility in rigidity gradients. Phys. Rev. Lett.118, 078103 (2017). - PMC - PubMed
    1. Chan, C. E. & Odde, D. J. Traction dynamics of filopodia on compliant substrates. Science322, 1687–1691 (2008). - PubMed
    1. Elosegui-Artola, A., Trepat, X. & Roca-Cusachs, P. Control of mechanotransduction by molecular clutch dynamics. Trends Cell Biol.28, 356–367 (2018). - PubMed

LinkOut - more resources