Clinical Trial
. 2025 Nov;31(11):3879-3888.
doi: 10.1038/s41591-025-03993-0. Epub 2025 Oct 15.

Budigalimab, an anti-PD-1 inhibitor, for people living with HIV-1: a randomized, placebo-controlled phase 1b study

Affiliations
Clinical Trial

Budigalimab, an anti-PD-1 inhibitor, for people living with HIV-1: a randomized, placebo-controlled phase 1b study

Moti N Ramgopal et al. Nat Med. 2025 Nov.

Abstract

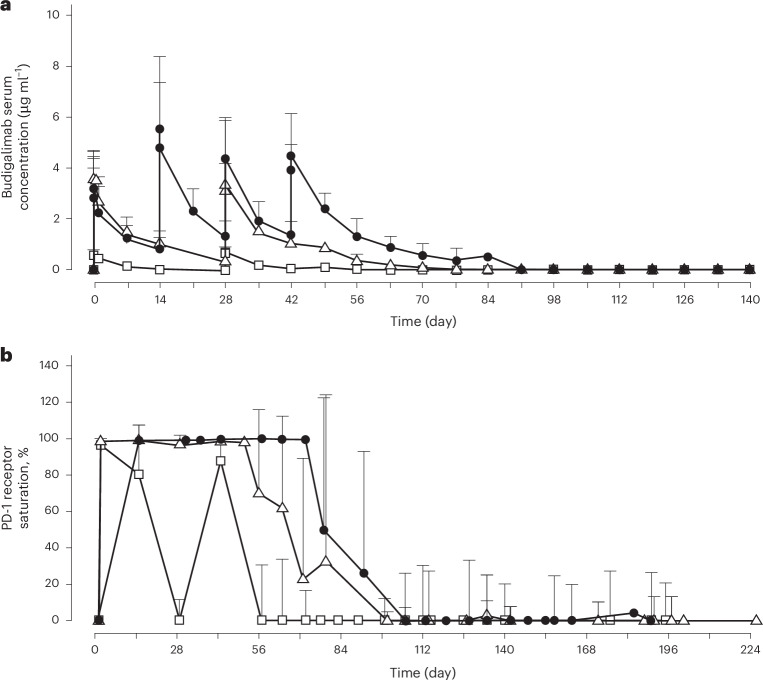
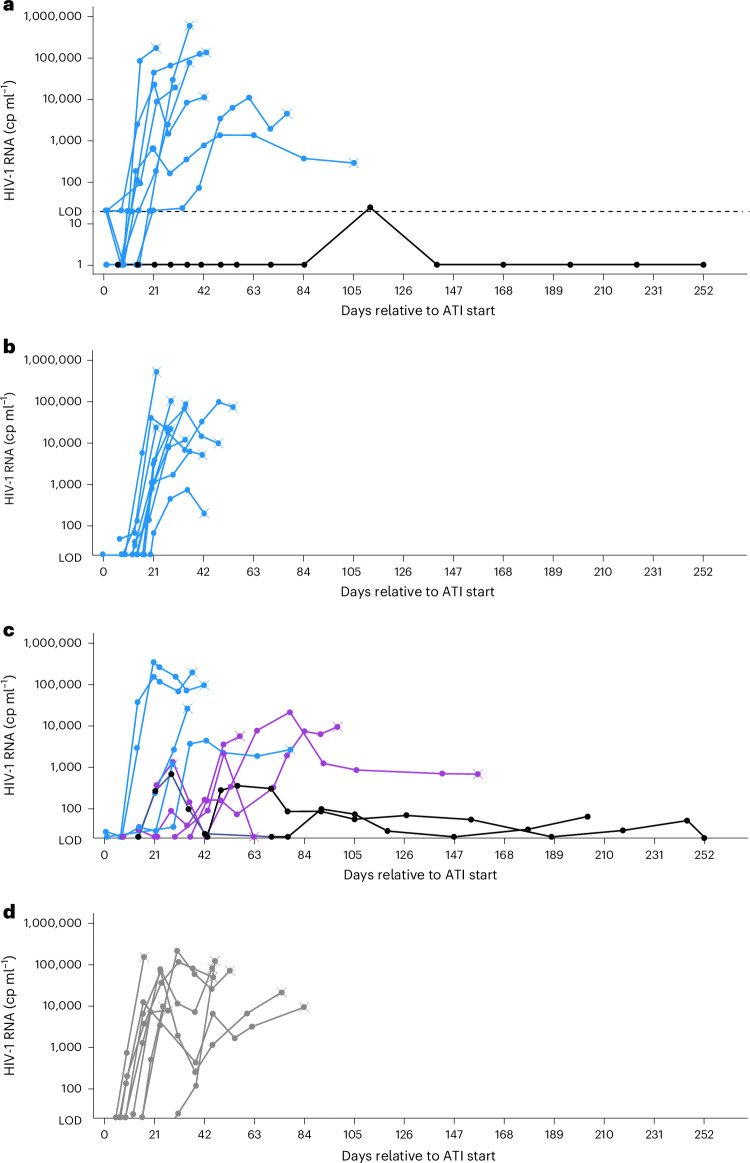
Chronic human immunodeficiency virus type 1 (HIV-1) disease results in immune exhaustion and dampened T cell responses, and programmed cell death 1 (PD-1) inhibitors offer a potential approach to enable viral control without antiretroviral therapy (ART) through reversal of these effects. Budigalimab is an investigational humanized anti-PD-1 monoclonal antibody. Multiple intravenous (IV) low doses of budigalimab (Stage 1: 2 mg n = 10, 10 mg n = 10, placebo n = 5, two doses every 4 weeks; Stage 2: 10 mg n = 11, placebo n = 5, four doses every 2 weeks (Q2W)) were assessed in people living with HIV (PLWH; n = 41) in a randomized, double-blind, multicenter, placebo-controlled phase 1 study with an analytical treatment interruption (ATI) to identify an efficacious regimen with a favorable safety profile in PLWH. The primary endpoints were safety, tolerability and pharmacokinetics. Demographics and baseline characteristics were balanced across treatment groups, except for sex, which was mostly male. All participants identified as cisgender. Budigalimab was well tolerated for up to 44 weeks, with 29 of 41 participants experiencing an adverse event (AE), including 2 participants who each experienced one grade 1 reversible immune-related AE (thyroiditis, hyperthyroidism). Three grade 3 AEs were reported by two participants and one serious AE by one participant; none were deemed related to treatment. IV budigalimab 10 mg Q2W resulted in a slight accumulation of drug in serum, with concentrations remaining above the estimated concentration required for near-complete (>95%) PD-1 receptor saturation on CD8+ T cells for ~10 weeks in peripheral blood. In an exploratory efficacy analysis of a 12-week ATI initiated with the first of four 10 mg Q2W doses, 6 of 11 participants experienced a delayed rebound with a relatively low viral peak and/or off-ART viral control (<200 copies ml-1) for ≥6 weeks during ATI, with 2 sustaining ART-free viral control to study end (204-252 days). The study achieved prespecified endpoints, supporting further evaluation of budigalimab in PLWH in a phase 2 study. ClinicalTrials.gov identifier: NCT04223804 .


Conflict of interest statement

Competing interests: M.N.R. is a speaker for AbbVie, Gilead Sciences and ViiV Healthcare and is a consultant for Gilead Sciences, ViiV Healthcare, Merck and Abbott. J.P.L. has no disclosures to declare. A.G.P.d.S., P.K., T.R.V., F.Z., H.B., P.D. and N.M.M. are employees of AbbVie and may own stock and/or stock options. M.L.A. sits on the Gilead Sciences advisory board. F.F. is a speaker and consultant for AbbVie, Gilead Sciences, Merck & Co. and ViiV Healthcare. J.P.R. is a speaker and consultant for AbbVie, Gilead Sciences, Merck & Co., Moderna and ViiV Healthcare and is partially supported for research infrastructure from the Canadian HIV cure entreprise 3.0 (CIHR: BR4-197730).

Figures

Fig. 1
Fig. 1
Full CONSORT participant flow diagram for Study M19-939 a) stage I and b) stage II. ART, antiretroviral therapy; IV, intravenous.
Fig. 2
Fig. 2. Budigalimab pharmacokinetics and pharmacodynamics.
a,b, Serum concentration–time profiles of budigalimab (a) and PD-1 receptor saturation on CD8+ T cells (b), as measured by percent PD-1 receptor saturation, with repeated IV dosing. Squares represent mean (+standard deviation (s.d.)) values with two doses of 2 mg IV Q4W (stage I; n = 10). Triangles represent mean (+s.d.) values with two doses of 10 mg IV Q4W (stage I; n =10). Black circles represent mean (+s.d.) values with four doses of 10 mg IV Q2W (stage II; n = 11). IV, intravenous; PD-1, programmed cell death 1; Q2W, every 2 weeks; Q4W, every 4 weeks.
Fig. 3
Fig. 3. Viral load kinetics during ATI.
ad Individual plasma HIV-1 RNA levels (log scale) of participants receiving (a) two doses of budigalimab 2 mg IV Q4W with ATI starting at week 4 with the second dose (n = 9; one participant maintained a viral load <50 copies ml−1 through ATI to study end); (b) two doses of budigalimab 10 mg IV Q4W with ATI starting at week 4 with the second dose (n = 10); (c) four doses of budigalimab 10 mg IV Q2W with ATI starting on day 0 with the first dose (n = 11; two participants discontinued study drug: one for protocol violation (prohibited live vaccination) and one for AE (grade 1 reversible hyperthyroidism)); and (d) placebo in stage I or stage II (n = 9). Blue lines represent participants taking budigalimab and not exhibiting a delay in viral rebound (>21 days) and/or off-ART viral control (<200 copies ml−1); purple and black lines represent participants taking budigalimab and experiencing a delay in viral rebound and/or off-ART viral control, with black lines differentiating the participants who remained off ART for entire study period; and gray lines represent participants receiving placebo. Data points marked with an X represent the last observed point before reinitiation of ART. Dashed line represents LOD of viral load assay (20 copies ml−1). ART, antiretroviral therapy; ATI, analytical treatment interruption; cp, copies; IV, intravenous; LOD, limit of detection; Q2W, every 2 weeks; Q4W, every 4 weeks.
Extended Data Fig. 1
Study design. aATI planned for 12 weeks; ART-restart criteria were ≥1 of the following: ≥2 consecutive plasma HIV-1 RNA measures ≥1000 copies/mL for ≥4 weeks; ≥2 consecutive measures of >30% decline from baseline CD4 + T cell count or absolute CD4 + T cell count <350 cells/µL; HIV-associated symptoms, including symptoms of retroviral rebound syndrome; pregnancy; or participant or investigator request to reinitiate ART. ART, antiretroviral therapy; ATI, analytical treatment interruption; IV, intravenous; PBO, placebo.
Extended Data Fig. 2
HIV-1 RNA curves over entire study for each participant receiving A) budigalimab 10 mg IV Q2W×4, and B) placebo (combined stage I and stage II). Note variation in y-axis scale. Gray boxes represent RNA values collected outside of analytical treatment interruption. ART, antiretroviral therapy; cp, copies; IV, intravenous; Q2W, every 2 weeks.
Extended Data Fig. 3
Extended Data Fig. 3. Expression of T cell activation and proliferation markers.
Change in the expression of proliferation and activation markers A) Ki67, B) HLA-DR, and C) Granzyme B+ on CD8+ memory cells relative to baseline and correlation between plasma HIV RNA and D) Ki67, E) HLA-DR, and F) Granzyme B in stage I and stage II of the study. Spearman correlations were conducted grouping the entire dataset. T cell memory subsets were assessed using markers CD45RO and CCR7. Naive cells were identified as CD45RO − CCR7 + , central memory cells were identified as CD45RO + CCR7 + , TM/EM cells were identified as CD45RO + CCR7 − , TE cells were identified as CD45RO − CCR7− cells, and memory cells were identified as CD45RO+ cells. HLA-DR, human leukocyte antigen DR; Ki67, markers antigen Kiel 67; PBO, placebo; TM/EM, transient/effector memory.
Extended Data Fig. 4
Extended Data Fig. 4. T cell subsets during ATI.
Immunophenotyping at baseline and during a viremic time point indicating changes in A) T follicular helper-like (TFH) cells, B) peripheral CXCR5 + CD8 + T cells, and C) CCR6 + CD4 + T cells. Crosses indicate the 5 of the 6 participants in the stage II budigalimab 10-mg Q2W×4 arm who experienced a delayed viral rebound with a low viral load and/or viral load resuppression after rebound. P-values were assessed using Wilcoxon matched-pairs signed rank test. Viral load in the post-baseline samples ranged between undetectable and 81,950 copies/mL in the 10-mg Q4W×2 arm, between 405 and 54,400 copies/mL in the PBO arm, and between 22 and 96,400 copies/mL in the 10-mg Q2W×4 arm. Nearly complete PD-1 receptor saturation with budigalimab ( > 95 %) was observed on CD4+ and CD8 + T cells at the post-baseline sample in both 10-mg treatment arms (data not shown). Non-naive CD4+ and CD8 + T cell populations were identified using markers CD45RO, CD28, and CCR7, wherein naive cells were identified as CD28 + CD45RO − CCR7+ cells and a Boolean filter was utilized to distinguish non-naive cells. Although, Th1 is defined as CCR4 − CCR6 − CXCR3+ cells, Th2 as CCR4 + CCR6 − CXCR3− cells, Th17 as CCR6 + CD161+ or CCR6+ cells, and TFH-like as CXCR5+ cells, CXCR3+ cells could not be gated appropriately. Hence, within CD4 + T cell non-naive cells, cells were gated with CCR4 and CCR6 markers. At baseline, 71% ± 14% of the CD8 + /non-naive/CXCR5+ cells expressed PD-1 and 42% ± 8% of TFH-like cells expressed PD-1 (data not shown). No changes in CD4 + /non-naive/CCR4+ cells were apparent at post-baseline time points (data not shown). ATI; analytical treatment interruption; PBO, placebo; Q4W, every 4 weeks.

References

    1. AIDSinfo. Global HIV & AIDS statistics (United Nations Joint Programme on HIV/AIDS). http://aidsinfo.unaids.org (accessed 19 August 2024).
    1. Peterson, T. E. & Baker, J. V. Assessing inflammation and its role in comorbidities among persons living with HIV. Curr. Opin. Infect. Dis.32, 8–15 (2019). - PubMed
    1. Grund, B. et al. Relevance of interleukin-6 and D-dimer for serious non-AIDS morbidity and death among HIV-positive adults on suppressive antiretroviral therapy. PLoS One11, e0155100 (2016). - PMC - PubMed
    1. Armah, K. A. et al. HIV status, burden of comorbid disease, and biomarkers of inflammation, altered coagulation, and monocyte activation. Clin. Infect. Dis.55, 126–136 (2012). - PMC - PubMed
    1. Hasse, B. et al. Morbidity and aging in HIV-infected persons: the Swiss HIV cohort study. Clin. Infect. Dis.53, 1130–1139 (2011). - PubMed

Publication types

MeSH terms

Substances

Associated data