. 2025 Oct 15;23(1):1106.
doi: 10.1186/s12967-025-07089-8.

Nuclear receptor Nr1d1 links sleep deprivation to intestinal homeostasis via microbiota-derived taurine

Affiliations

Nuclear receptor Nr1d1 links sleep deprivation to intestinal homeostasis via microbiota-derived taurine

Zhaoyang Wang et al. J Transl Med. .

Abstract

Background: Sleep deficiency significantly compromises human health, with the gut being particularly susceptible. However, the molecular mechanisms by which gut microbiota mediate sleep deprivation-induced intestinal dysfunction remain largely undefined. In this study, we employed a chronic sleep deprivation (CSD) mouse model to investigate the impact of sleep loss on intestinal integrity and microbial composition.

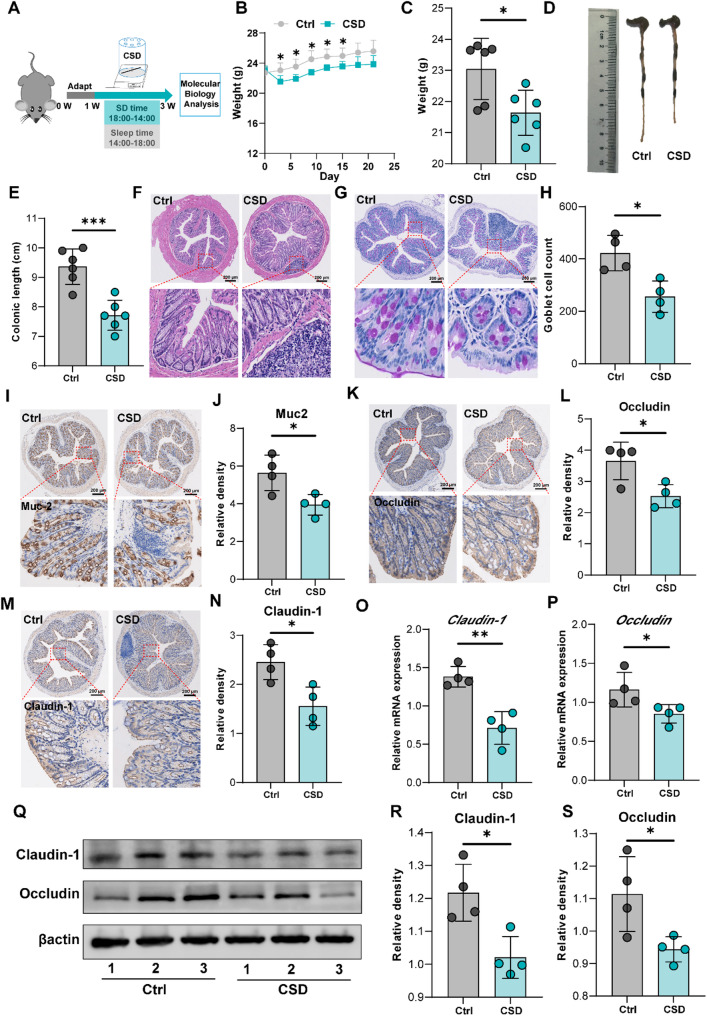
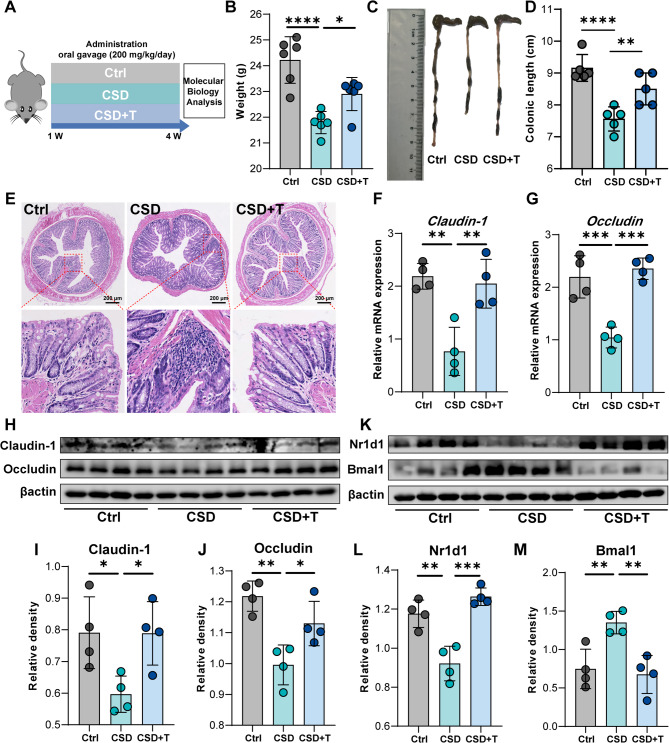
Methods: The CSD mouse model was established using the modified multiple platform (rotating rod) method. Colon histomorphology was assessed by hematoxylin and eosin (HE) staining. Expression levels of barrier proteins (Occludin, Claudin-1) and circadian regulators (Nr1d1, Bmal1) were evaluated via Western blot or immunohistochemistry (IHC). Gut microbiota composition and stability were analyzed by 16S rRNA gene sequencing, and the causal role of microbiota in CSD-induced barrier damage was assessed through fecal microbiota transplantation (FMT). RNA sequencing (RNA-seq) of intestinal epithelial tissues identified differentially expressed genes and enriched pathways. Untargeted metabolomics was employed to investigate key differential metabolites (Taurine). Additionally, taurine was supplemented in vivo to explore its efficacy and mechanism in alleviating intestinal barrier damage in CSD mice.

Results: CSD led to pronounced colon shortening and significant downregulation of the epithelial barrier proteins Occludin and Claudin-1, indicative of impaired intestinal barrier function. Moreover, CSD exacerbated symptoms of chemically induced colitis and induced gut microbiota dysbiosis. Mechanistically, FMT from CSD mice into antibiotic-treated recipients recapitulated intestinal inflammation, confirming the pathogenic role of the altered microbiota. Transcriptomic analysis revealed significant enrichment of genes involved in circadian rhythm pathways, notably a marked suppression of the circadian nuclear receptor Nr1d1, a key regulator of intestinal homeostasis. Complementary untargeted metabolomic profiling identified taurine as a microbiota-derived metabolite significantly reduced by CSD. In vivo taurine supplementation restored Nr1d1 expression, reinforced epithelial barrier integrity, and decreased pro-inflammatory cytokine production.

Conclusion: Together, these findings reveal a gut microbiota-taurine-Nr1d1 axis underlying sleep deprivation-induced intestinal barrier dysfunction, and suggest that therapeutic modulation of taurine levels or circadian pathways may offer novel strategies to prevent or treat sleep-related gastrointestinal disorders.

Keywords: Circadian rhythm; Gut microbiota; Nuclear receptor; Sleep deprivation; Taurine.


Conflict of interest statement

Declarations. Ethical approval and consent to participate: Not applicable. Consent for publication: Not applicable. Competing interests: The authors declare no competing financial interests.

Figures

Fig. 1
Fig. 1
Sleep deprivation disrupts intestinal barrier integrity in mice. A Schematic illustration of the chronic sleep deprivation (CSD) model, and control (Ctrl) group mice were raised normally. B Body weight of mice recorded every three days. C Body weight of mice on day 3. D Representative macroscopic images of mouse colons. E Statistical analysis of colon length based on (D). F H&E staining of distal colon tissues. G Periodic acid–Schiff (PAS) staining for goblet cells in colon tissue. H Quantification of goblet cell numbers shown in (G), performed using ImageJ software. I, K, M Immunohistochemical staining of colon tissue, where brown represents Muc2 (I), Occludin (K), and Claudin-1 (M), respectively, and blue represents the nuclei. J, L, N The expression levels of Muc2, Occludin, and Claudin-1 in (I, K, M) were quantitatively analyzed using ImageJ. O, P qPCR was employed to detect the mRNA expression of Claudin-1 and Occludin in colonic tissues, with β-actin as the internal reference. Q Western blot was used to detect the protein expression levels of Claudin-1 and Occludin in colonic tissues. R, S The gray values of Claudin-1 and Occludin in (Q) were quantified using ImageJ and compared with that of β-actin. (n = 4 to 6). Data are expressed as means ± SD. *p < 0.05, **p < 0.01, ***p < 0.001
Fig. 2
Fig. 2
Chronic sleep deprivation exacerbates DSS-induced colitis by disrupting intestinal barrier integrity. A 2.5% DSS-induced colitis (DSS group) and CSD (DSS + CSD group) schematic diagram. B Representative photographs of mouse colons after 2.5% DSS and CSD treatment. C Perform statistical analysis on the length of the colon in (B). D Statistical results of mouse body weight. E The Disease Activity Index (DAI) = (Weight loss score + Stool characters score + Hematochezia score)/3. F HE staining of mouse colon. G, I The expression of Muc2 and Occludin in the mouse colon was detected by immunohistochemistry. H, J The expression level of Muc2 and Occludin in (G, I) was quantified using ImageJ. K, L The mRNA expression levels of Claudin-1 and Occludin in the colon of mice were detected by qPCR. M The expression level of Claudin-1 and Occludin protein was detected by Western blot. N The expression of Claudin-1 and Occludin in (M) was quantified by ImageJ. OQ The mRNA expression levels of Il-10, Il-6, and Il-1β in the colon of mice were detected by qPCR (n = 4 to 6). Data are expressed as means ± SD. *p < 0.05, **p < 0.01, ***p < 0.001, ****p < 0.0001
Fig. 3
Fig. 3
Chronic sleep deprivation alters gut microbiota composition and reduces microbial diversity. A PCA of 16S rRNA microbiota sequencing results, where the abscissa represents 19.27% of PC1 and the ordinate represents 18.24% of PC2. B, C Differences in the microbiota at the Class and Family levels. D, E Differences in microbiota diversity (chao1) and richness (observed). F Venn diagram analysis of the differences in the number of microbiota between the control and CSD groups. G Conduct a phylogenetic tree analysis of the differences in shared microbiota at the phylum level. HM Relative abundances of the probiotic Akkermansiaceae, the pathogenic bacterium Ralstonia, the Gram-negative bacterium [Acetivibrio]_ethanolgignens, the Gram-positive bacterium Anaerostipes, the bacterium Allobaculum and Burkholderiaceae in the control and CSD groups
Fig. 4
Fig. 4
Transplantation from sleep-deprived mice induces disruption of intestinal barrier integrity in antibiotic-treated recipients. A Schematic diagram of fecal microbiota transplantation (FMT), F-CSD represents receiving gut microbiota from CSD mice, and F-Ctrl represents receiving gut microbiota from control mice. B The body weight of mice 3 weeks after FMT. C Representative photographs of the mouse colon after fecal microbiota transplantation. D Statistical analysis of the colon length in (C). E H&E staining of distal colon tissues. F PAS staining for goblet cells in colon tissue. (G) Quantification of goblet cell numbers shown in (F), performed using ImageJ software. H, J, L Immunohistochemical staining of colon tissue, where brown represents Muc2 (H), Occludin (J), and Claudin-1 (L), respectively, and blue represents the nuclei. I, K, M The expression levels of Muc2, Occludin, and Claudin-1 in (H, J, L) were quantitatively analyzed using ImageJ. N, O qPCR was employed to detect the mRNA expression of Claudin-1 and Occludin in colonic tissues, with β-actin as the internal reference. P Western blot was used to detect the protein expression levels of Claudin-1 and Occludin in colonic tissues. Q, R The gray values of Claudin-1 and Occludin in (P) were quantified using ImageJ and compared with that of β-actin (n = 4 to 6). Data are expressed as means ± SD. *p < 0.05, **p < 0.01
Fig. 5
Fig. 5
Chronic sleep deprivation disrupts circadian rhythms in intestinal epithelial tissues. A PCA of intestinal epithelium tissue based on RNA-seq analysis. B The volcano plot displays the differentially expressed genes in CSD compared to control. C KEGG pathway enrichment analysis of differentially expressed genes. D Schematic diagram of intestinal epithelial tissue collected at 6 different time points (ZT: Zeitgeber time, hours after the start of the light period). E, F qPCR analysis of Bmal1 and Nr1d1 mRNA expression in the intestinal epithelium tissues of the control and CSD at different time points. G Western blot analysis of Bmal1, and Nr1d1 protein expression in the intestinal epithelium tissues of the control and CSD at different time points. H, I Quantification of Nr1d1 and Bmal1 in (G) was performed using ImageJ (n = 4 to 6). Data are expressed as means ± SD. *p < 0.05, **p < 0.01, ****p < 0.0001
Fig. 6
Fig. 6
Disruption of taurine metabolism links gut microbial dysbiosis to intestinal injury under sleep deprivation. A PCA was performed on the untargeted microbial metabolites of control and CSD mice. B The volcano plot displays differential metabolites. C Functional enrichment analysis of differential metabolites. D Conduct KEGG enrichment pathway analysis on metabolites associated with metabolic functions. E The CSD group, compared to the control group, characterized the top 10 differential metabolites, with red indicating upregulation and blue indicating downregulation. F, G The levels of Taurocholic acid and Taurolithocholic acid associated with taurine-conjugated metabolites in different groups. H, I The relative expression of microbiota Lactobacillus and Bilophila wadsworthia, which are closely associated with taurine, in the CSD and control groups, as derived from the 16S rRNA sequencing results in Fig. 3
Fig. 7
Fig. 7
Taurine supplementation ameliorates sleep deprivation-induced intestinal injury. A Schematic diagram of sleep deprivation and taurine (T) administration. B The body weights of mice in each group were recorded after the completion of taurine treatment. C Representative image of mouse colon. D Statistical analysis of the colon length in (C). E Representative images of HE staining in mouse colon. F, G qPCR was employed to detect the mRNA expression of Claudin-1 and Occludin in the intestinal epithelium tissues, with β-actin as the internal reference. (H) The expression levels of Claudin-1 and Occludin proteins in the intestinal epithelium tissues were detected by Western blot. I, J The gray values of Claudin-1 and Occludin in (H) were quantified using ImageJ and compared with that of β-actin. K The expression levels of Nr1d1 and Bmal1 proteins in the intestinal epithelium tissues were detected by Western blot. L, M The gray values of Nr1d1 and Bmal1 in (K) were quantified using ImageJ and compared with that of β-actin (n = 4 to 6). Data are expressed as means ± SD. *p < 0.05, **p < 0.01, ***p < 0.001, ****p < 0.0001
Fig. 8
Fig. 8
Taurine reverses NR1D1 antagonist-exacerbated intestinal barrier dysfunction in chronic sleep deprivation. A Schematic diagram of the treatment of CSD model mice with SR8278 and taurine (T). B Body weight of the mice. C Representative images of HE staining of the mouse colon. D Western blot analysis of the protein expression levels of Occludin and Nr1d1 in the intestinal epithelial tissue of mice, with β-actin as the internal control. E Quantification of the expression levels of Occludin in (D) using ImageJ, compared to β-actin. F Immunohistochemical detection of Claudin-1 (brown) expression in the colon tissue of mice, with nuclei stained blue. G Quantification of Claudin-1 in (F) using ImageJ. H PAS staining marks glycogen (pink) in the mouse colon, with nuclei appearing blue. I Goblet cells in (H) were quantified using ImageJ (n = 4 to 6)

References

    1. Liew SC, Aung T. Sleep deprivation and its association with diseases—a review. Sleep Med. 2021;77:192–204. 10.1016/j.sleep.2020.07.048. - PubMed
    1. Siegel JM. Sleep function: an evolutionary perspective. Lancet Neurol. 2022;21:937–46. 10.1016/s1474-4422(22)00210-1. - PMC - PubMed
    1. Bapun G, et al. Sleep loss diminishes hippocampal reactivation and replay. Nature. 2024. 10.1038/s41586-024-07538-2. - PMC - PubMed
    1. Lindsay S, Caroline W, Edwin WC, Aaron DF. Effect of sleep restriction on adolescent cognition by adiposity. JAMA Neurol. 2024. 10.1001/jamaneurol.2024.1332.
    1. Di S, et al. Prolonged sleep deprivation induces a cytokine-storm-like syndrome in mammals. Cell. 2023. 10.1016/j.cell.2023.10.025. - PubMed

Substances

LinkOut - more resources