. 2025 Sep 28;26(19):9507.
doi: 10.3390/ijms26199507.

Exposure to Bisphenol B and S Increases the Risk of Male Reproductive Dysfunction in Middle Age

Affiliations

Exposure to Bisphenol B and S Increases the Risk of Male Reproductive Dysfunction in Middle Age

Sen Zhao et al. Int J Mol Sci. .

Abstract

Accumulating evidence indicates that bisphenol A (BPA) analogs, including bisphenol B (BPB) and bisphenol S (BPS), disrupt testicular function and contribute to male reproductive dysfunction (MRD). However, whether BPA analogs are involved in MRD among middle-aged men remains inconclusive. Therefore, we selected cryptorchidism, erectile dysfunction, premature ejaculation, and testicular tumors as representative MRD conditions in middle-aged individuals, aiming to explore the molecular mechanisms that may be disrupted by bisphenols (BPs). By using GeneCards, STRING and Cytoscape, TP53, AKT1, and MYC were pinpointed as core targets associated with MRD. Enrichment analysis suggested that BPs may induce MRD by disrupting steroidogenesis. UPLC-MS/MS analysis showed that both BPB and BPS exhibit specific accumulation in the testes. Following 20-day exposure to 0.3 or 0.6 mg/kg body weight/day BPB or BPS, testosterone levels and the expression of hub genes were decreased. The molecular docking results demonstrated that both BPB and BPS can directly bind to members of the cytochrome P450 family, potentially interfering with sex hormone biosynthesis. Our study identified the targets and mechanisms through which BPB and BPS induce MRD in middle-aged males, thereby providing insights for the safety assessment of BPs.

Keywords: bisphenol B; bisphenol S; male reproduction dysfunction; middle-age; network toxicology.


Conflict of interest statement

The authors declare no conflicts of interest.

Figures
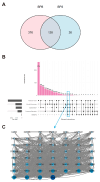
Figure 1
Figure 1
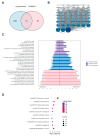
Genes co-expressed in BPB and BPS. (A) Venn diagram illustrating the overlapping target genes of BPB and BPS identified from the GeneCards database. (B) Upset plot showing the intersection of gene targets among four MRDs. The pink bars represent the quantity of genes within each set. The black dots denote the associated MRD disease sets. And the gray histogram illustrates the gene counts across the four MRD diseases. (C) PPI network of potential therapeutic targets associated with MRDs, constructed using the STRING database and visualized with Cytoscape. Each node represents a protein. The size and color intensity of the nodes indicate the number of interactions, with larger and darker nodes representing proteins that interact with more partners.
Figure 2
Figure 2
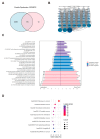
The associations between BPs and cryptorchidism. (A) Venn diagram showing the overlapping targets between BPs exposure and cryptorchidism-associated genes. (B) PPI network constructed from the potential therapeutic targets of BPs in cryptorchidism. Each node represents a protein. The size and color intensity of the nodes indicate the number of interactions, with larger and darker nodes representing proteins that interact with more partners. (C) GO enrichment analysis and (D) KEGG pathways enrichment analysis of the core targets. “GO numbers” indicate Gene Ontology term identifiers, and “Hsa” denotes Homo sapiens pathways.
Figure 3
Figure 3
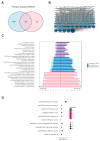
The associations between BPs and ED. (A) Venn diagram showing the overlapping targets between BPs exposure and ED-associated genes. (B) PPI network constructed from the potential therapeutic targets of BPs in ED. Each node represents a protein. The size and color intensity of the nodes indicate the number of interactions, with larger and darker nodes representing proteins that interact with more partners. (C) GO enrichment and (D) KEGG pathways enrichment analysis of the core targets. “GO numbers” indicate Gene Ontology term identifiers, and “Hsa” denotes Homo sapiens pathways.
Figure 4
Figure 4
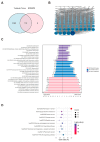
The associations between BPs and PE. (A) Venn diagram showing the overlapping targets between BPs exposure and PE-associated genes. (B) PPI network constructed from the potential therapeutic targets of BPs in PE. Each node represents a protein. The size and color intensity of the nodes indicate the number of interactions, with larger and darker nodes representing proteins that interact with more partners. (C) GO enrichment and (D) KEGG pathway enrichment analysis of the core targets. “GO numbers” indicate Gene Ontology term identifiers, and “Hsa” denotes Homo sapiens pathways.
Figure 5
Figure 5
The associations between BPs and TT. (A) Venn diagram showing the overlapping targets between BPs exposure and TT-associated genes. (B) PPI network constructed from the potential therapeutic targets of BPs in TT. Each node represents a protein. The size and color intensity of the nodes indicate the number of interactions, with larger and darker nodes representing proteins that interact with more partners. (C) GO enrichment and (D) KEGG pathways enrichment analysis of the core targets. “GO numbers” indicate Gene Ontology term identifiers, and “Hsa” denotes Homo sapiens pathways.
Figure 6
Figure 6
Molecular docking of BPs with potential receptors. (A) Docking results of AKT1, MYC and TP53, with the BPB, respectively. (B) Docking results of AKT1, MYC and TP53, with the BPS, respectively. BPB or BPS molecules are depicted in red.
Figure 7
Figure 7
Qualitative and quantitative analyses of BPs in mouse serum and testis. (A) For the single gavage administration, male mice were randomly divided into fifteen groups (n = 6 per group): a corn oil group (negative control) and BPB- and BPS-treated groups. Experimental sampling was performed at 0, 4, 8, 12, and 32 h post-administration. (B) UPLC-MS/MS analysis of BPB and BPS in mouse serum and testis, including representative chromatograms and chemical structures of BPB and BPS (100 μg/mL). (ac) UPLC-MS/MS analysis of BPB in mice blood, mice testis, and BPB. (d) Chemical structures of BPB. (eg) UPLC-MS/MS analysis of BPS in mice blood, mice testis, and BPS. (h) Chemical structures of BPS. (C) Concentrations of BPB and BPS in serum and testis following exposure. Data are presented as mean ± SEM (n = 3 per group).
Figure 8
Figure 8
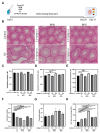
Changes in the testicular morphology and sex hormone levels of BPB- and BPS-exposed mice. (A) For the sub-chronic gavage administration, male mice were randomly divided into six groups (n = 6 per group): 0 mg/kg body weight (b.w.) (control), 0.3 mg/kg b.w. BPB, 0.6 mg/kg b.w. BPB, 0.3 mg/kg b.w. BPS, 0.6 mg/kg b.w. BPS, and 0.3 mg/kg b.w.17β-estradiol (E2). (B) Representative images of H&E staining (Scale bar = 100 μm) in mice testis sections after 20-day exposure. (C) Ratio of testis and body weight (testis/body weight × 100%) were examined. (n = 6). (D) Quantitative analysis of seminiferous tubule diameter and (E) seminiferous tubule circumference of the testis in mice (n = 6). (F) T and (G) E2 level with BPB or BPS. (H) Ratio of E2 and T (17β-estradiol/testosterone weight × 100%) were examined. The values are recorded as the means ± SEM. * p < 0.05, ** p < 0.01, *** p < 0.001 and **** p < 0.0001 compared with the corresponding control group.
Figure 9
Figure 9
Effects of exposure to BPB or BPS on the expression of steroidogenic enzyme in middle-age male mice. The mRNA levels of Cyp11a1, Cyp17a1, Hsd3b1, Hsd17b3 and Cyp19a1 were measured in testicular tissue using RT-qPCR. Gapdh served as an internal control. The values are recorded as the means ± SEM. * p < 0.05, ** p < 0.01, *** p < 0.001 and **** p < 0.0001 compared with the corresponding control group.
Figure 10
Figure 10
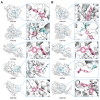
Molecular docking of BPs with Human steroidogenic enzyme. (A) Docking results of CYP11A1, CYP17A1, CYP19A1, HSD3B1, and HSD17B3, with the BPB, respectively. (B) Docking results of CYP11A1, CYP17A1, CYP19A1, HSD3B1, and HSD17B3, with the BPS, respectively. BPB or BPS molecules are depicted in red.

References

    1. Adegoke E.O., Rahman M.S., Pang M.-G. Bisphenols Threaten Male Reproductive Health via Testicular Cells. Front. Endocrinol. 2020;11:624. doi: 10.3389/fendo.2020.00624. - DOI - PMC - PubMed
    1. Den Braver-Sewradj S.P., Van Spronsen R., Hessel E.V.S. Substitution of Bisphenol A: A Review of the Carcinogenicity, Reproductive Toxicity, and Endocrine Disruption Potential of Alternative Substances. Crit. Rev. Toxicol. 2020;50:128–147. doi: 10.1080/10408444.2019.1701986. - DOI - PubMed
    1. Fernández M.F., Arrebola J.P., Jiménez-Díaz I., Sáenz J.M., Molina-Molina J.M., Ballesteros O., Kortenkamp A., Olea N. Bisphenol A and Other Phenols in Human Placenta from Children with Cryptorchidism or Hypospadias. Reprod. Toxicol. 2016;59:89–95. doi: 10.1016/j.reprotox.2015.11.002. - DOI - PubMed
    1. Rochester J.R. Bisphenol A and Human Health: A Review of the Literature. Reprod. Toxicol. 2013;42:132–155. doi: 10.1016/j.reprotox.2013.08.008. - DOI - PubMed
    1. Zhang B., He Y., Zhu H., Huang X., Bai X., Kannan K., Zhang T. Concentrations of Bisphenol A and Its Alternatives in Paired Maternal–Fetal Urine, Serum and Amniotic Fluid from an e-Waste Dismantling Area in China. Environ. Int. 2020;136:105407. doi: 10.1016/j.envint.2019.105407. - DOI - PubMed