. 2025 Oct 16;16(1):9185.
doi: 10.1038/s41467-025-64214-3.

HIFα isoform specific activities drive cell-type specificity of VHL-associated oncogenesis

Affiliations

HIFα isoform specific activities drive cell-type specificity of VHL-associated oncogenesis

Joanna D C C Lima et al. Nat Commun. .

Abstract

Cancers arising from dysregulation of generally operative signaling pathways are often tissue specific, but the mechanisms underlying this paradox are poorly understood. Based on striking cell-type specificity, we postulated that these mechanisms must operate early in cancer development and set out to study them in a model of von Hippel Lindau (VHL) disease. Biallelic mutation of the VHL ubiquitin ligase leads to constitutive activation of hypoxia inducible factors HIF1A and HIF2A and is generally a truncal event in clear cell renal carcinoma. We used an oncogenic tagging strategy in which VHL-mutant cells are marked by tdTomato, enabling their observation, retrieval, and analysis early after VHL-inactivation. Here, we reveal markedly different consequences of HIF1A and HIF2A activation, but that both contribute to renal cell-type specific consequences of VHL-inactivation in the kidney. Early involvement of HIF2A in promoting proliferation within the proximal tubular epithelium supports therapeutic targeting of HIF2A early in VHL disease.


Conflict of interest statement

Competing interests: P.J.R. is a non-executive director of Immunocore Holdings PLC. The remaining authors declare no competing interests.

Figures
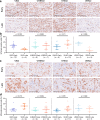
Fig. 1
Fig. 1. Contrasting response to HIFα activation in different renal regions.
Representative tdTomato IHC counterstained with hematoxylin in the renal papilla (a) or renal cortex and outer medulla (c) of VKO, VHKO, VEKO, and VHEKO mice given 5 × 2 mg tamoxifen and harvested early (1–3 weeks) or late (4–12 months) following recombination. Scale bar denotes 250 μm; ×20 magnification. Automated quantification (see “Methods”) of the proportion of cells that are tdTomato-positive in the renal papilla (b) or renal cortex and outer medulla (d). Pairwise comparisons by Kruskal-Wallis test with Dunn’s correction. Data are presented as median values, with the inter-quartile range indicated by error bars. The number of biological replicates for each condition is indicated.
Fig. 2
Fig. 2. Vhl-null cortical and outer medullary cells expand and proliferate in a HIFα-dependent manner.
Frequency distribution (a), and mean number (b) of tdTomato-positive neighbors of tdTomato-positive cells within a 16 μm radius in the cortex and outer medulla of VKO, VHEKO, VHKO, and VEKO mice harvested early or late after Vhl inactivation. c Representative dual IHC for Ki67 (brown) and tdTomato (purple) counterstained with methyl green. Scale bar denotes 50 μm; ×40 magnification. Area shown in the inset (black rectangle) illustrates tdTomato-positive Ki67-positive (black arrows) and tdTomato-positive Ki67-negative (red arrow) cells. d Automated quantification (see “Methods”) of the proportion of tdTomato-positive cells that are also Ki67-positive in cortex and outer medulla of ConKO, VKO, ConHKO, VHKO, ConEKO, VEKO, ConHEKO, and VHEKO mice harvested early after recombination. a, b, d Data are presented as median values, with the inter-quartile range indicated by error bars. The number of biological replicates for each condition indicated. a Frequency distributions compared using Wilk’s lambda statistic after testing by multivariate analysis of variance (MANOVA). b, d Pairwise comparisons by Kruskal-Wallis test with Dunn’s correction.
Fig. 3
Fig. 3. HIFα-dependent gene expression in Vhl-null cells.
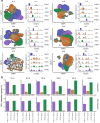
a UMAP plots depicting cells of the six PT identities from ConKO (blue), VKO (orange), VHKO (brown), VEKO (green), and VHEKO (purple) mice. Distribution of cells from each genotype across Louvain clusters are shown alongside each UMAP plot. Data are presented as median values, with the inter-quartile range indicated by error bars. n = 4 mice per genotype. b Isoform specificity of HIFα-dependent upregulation (top) or downregulation (bottom) of genes following Vhl inactivation in each PT identity. Bar charts depict the proportion of HIFα-dependent genes whose regulation was reversed by individual deletion of either Hif1a or Epas1 (‘HIF1A or HIF2A’; maroon), Hif1a but not Epas1 (‘HIF1A alone’; brown), Epas1 but not Hif1a (‘HIF2A alone’; green), or only by combined Hif1a and Epas1 deletion (‘HIF1A + HIF2A’; purple).
Fig. 4
Fig. 4. HIF1A and HIF2A regulate distinct biological processes in Vhl-null cells.
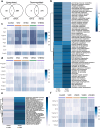
a Venn diagrams depicting intersections between genes whose Vhl-dependent upregulation (left) or downregulation (right) in any PT identity is reversed specifically by Hif1a deletion (‘HIF1A’) or specifically by Epas1 deletion (‘HIF2A’). ‘HIF1A’ and ‘HIF2A’ gene sets have been pooled across all PT identities. Only one or none of the genes are up- or downregulated specifically by different HIFα isoforms in different PT identities. b Gene Ontology terms for biological processes that are significantly over-represented (p < 0.01; one-sided Fisher’s exact test with multiple testing correction by false discovery rate) within groups of genes whose Vhl-dependent upregulation is reversed specifically by Hif1a or Epas1 deletion. Terms are ordered and tiles are colored by the average log2-fold changes for HIFIA- or HIF2A-dependent genes that are members of each GO term in VHKO vs VKO or VEKO vs VKO mice. Single-cell heatmaps depicting scaled expression of selected genes whose Vhl-dependent upregulation is specifically reversed by Hif1a deletion (c), or Epas1 deletion (d). e Gene Ontology terms for biological processes that are significantly over-represented (p < 0.01; one-sided Fisher’s exact test with multiple testing correction by false discovery rate) within genes whose Vhl-dependent downregulation is reversed specifically by Epas1 deletion (‘HIF2A’). Terms are ordered and tiles are colored by the average log2-fold changes for HIFIA- or HIF2A-dependent genes that are members of each GO term in VHKO vs VKO or VEKO vs VKO mice. f Single-cell heatmaps depicting scaled expression of selected genes whose Vhl-dependent downregulation is specifically reversed by Epas1 deletion.
Fig. 5
Fig. 5. Vhl-null PT cells dedifferentiate in a HIF2A-dependent manner.
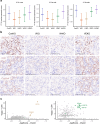
a Expression scores (see “Methods”) for genes recognized as PT S1, S2, and S3 markers scored in PT S1, S2, and S3 cells, respectively from ConKO, VKO, VHKO, VEKO, and VHEKO mice harvested late after recombination. Data are presented as median values, with the inter-quartile range indicated by error bars. b Representative RNA in situ hybridization (n = 3 mice per condition per transcript) depicting the expression of PT S1 marker Slc5a12, PT S2 marker Inmt, and PT S3 marker Cyp2a4 in renal cortex of ConKO, VKO, VHKO, and VEKO mice given 5 × 2 mg tamoxifen and harvested late (4–12 months) following recombination. Scale bar denotes 100 μm; ×40 magnification. c Transcription factor (TF) binding sites at loci of HIF1A-specific (left) or HIF2A-specific genes (right), as predicted by LISA and CheA3. Scatter plots depict the likelihood (log10-transformed p values for LISA and a ‘score’ for CheA3 analysis) that binding sites for a TF are enriched at loci of the set of HIF1A-specific or HIF2A-specific genes. TFs that are ranked in the top 50 for enrichment in both LISA and CheA3 analyses are colored and labeled.
Fig. 6
Fig. 6. HIF1A and HIF2A differentially contribute to early and adaptive changes in gene expression in Vhl-null cells.
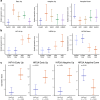
a Effect of HIFα deletion on ‘early’ and ‘adaptive’ Vhl-dependent gene expression. To relate the observed expression in each HIFα-inactivated genotype to the full extent of Vhl-dependent gene expression when HIFα isoforms are intact, the expression scores are scaled so that a score of 0 corresponds to median score for ConKO cells. The median score in VKO cells is scaled to a value of 1 for upregulated genes and −1 for downregulated genes. b Changes in HIF1A-specific and HIF2A-specific gene expression in Vhl-null cells over time. To relate the observed expression in cells to the full extent of HIFα-dependent gene expression late after Vhl inactivation, the expression scores are scaled so that a score of 0 corresponds to median score for ConKO cells early after recombination. The median score in VKO cells late after recombination is scaled to a value of 1 for upregulated genes and −1 for downregulated genes. HIF1A-dependent genes change little over time whereas greater upregulation and downregulation is observed for HIF2A-dependent genes (compare VKO Late (red) and VKO Early (orange) bars). c Expression of sets of genes upregulated early after Vhl inactivation in a manner dependent on HIF1A (‘HIF1A Early Up’) or HIF2A (‘HIF2A Early Up’) or regulated specifically over time in Vhl-null PT cells in a HIF2A-dependent manner (‘HIF2A Adaptive Up’ and ‘HIF2A Adaptive Down’) in human ccRCC versus normal adjacent renal tissue as available in The Cancer Genome Atlas (accessed on 14 April 2025). Pairwise comparisons by Kruskal-Wallis test with multiple testing correction using Bonferroni’s method. The number of biological replicates for each condition indicated. a–c Data are presented as median values, with the inter-quartile range indicated by error bars.

References

    1. Gossage, L., Eisen, T. & Maher, E. R. VHL, the story of a tumour suppressor gene. Nat. Rev. Cancer15, 55–64 (2015). - PubMed
    1. Kaelin, W. G. The von Hippel–Lindau tumor suppressor protein. Annu. Rev. Cancer Biol.2, 91–109 (2018).
    1. Mitchell, T. J. et al. Timing the landmark events in the evolution of clear cell renal cell cancer: TRACERx Renal. Cell173, 611–623 e617 (2018). - PMC - PubMed
    1. Jonasch, E., Walker, C. L. & Rathmell, W. K. Clear cell renal cell carcinoma ontogeny and mechanisms of lethality. Nat. Rev. Nephrol.17, 245–261 (2021). - PMC - PubMed
    1. Ishihara, H. et al. Genetic and epigenetic profiling indicates the proximal tubule origin of renal cancers in end-stage renal disease. Cancer Sci.111, 4276–4287 (2020). - PMC - PubMed

MeSH terms

Substances

LinkOut - more resources