. 2025 Oct 16;16(1):8968.
doi: 10.1038/s41467-025-64593-7.

Individualized prescriptive inference in ischaemic stroke

Affiliations

Individualized prescriptive inference in ischaemic stroke

Dominic Giles et al. Nat Commun. .

Abstract

The gold standard in the treatment of ischaemic stroke is set by evidence from randomized controlled trials, typically using simple estimands of presumptively homogeneous populations. Yet the manifest complexity of the brain's functional, connective, and vascular architectures introduces heterogeneities that violate the underlying statistical premisses, potentially leading to substantial errors at both individual and population levels. The counterfactual nature of interventional inference renders quantifying the impact of this defect difficult. Here we conduct a comprehensive series of semi-synthetic, biologically plausible, virtual interventional trials across 100M+ distinct simulations. We generate empirically grounded virtual trial data from large-scale meta-analytic connective, functional, genetic expression, and receptor distribution data, with high-resolution maps of 4K+ acute ischaemic lesions. Within each trial, we estimate treatment effects using models varying in complexity, in the presence of increasingly confounded outcomes and noisy treatment responses. Individualized prescriptions inferred from simple models, fitted to unconfounded data, are less accurate than those from complex models, even when fitted to confounded data. Our results indicate that complex modelling with richly represented lesion data may substantively enhance individualized prescriptive inference in ischaemic stroke.


Conflict of interest statement

Competing interests: D.G., J.C., S.O., G.R. and P.N. are affiliated with Hologen, a healthcare deep generative modelling company. C.F., G.P., J.K.R., T.X., H.R.J. and A.J. declare no competing interests.

Figures

Fig. 1
Fig. 1. Inferring treatment effects in the setting of heterogeneity.
Consider a hypothetical scenario where the members of a population described on continuous dimensions (x & y) systematically differ in their responsiveness to two treatments (A (red) & B (blue)). The two populations differ in size (A is smaller), and are non-linearly distinguished by their features (occupying diametrically opposed quadrants of the feature space). A statistical model of the optimal treatment that ignores the heterogeneity entirely, unconditionally averaging across all patients, inevitably favours B wholesale as the larger proportion, achieving chance level balanced accuracy (upper right). A model accounting for heterogeneity in simple, linear terms (a linear support vector machine) achieves only slightly better accuracy, for the distinguishing features are not linearly separable (lower left). By contrast, a model flexible enough to absorb complex, non-linearly defined heterogeneity (a support vector machine with a radial basis function kernel) achieves near perfect balanced accuracy (lower right). Note the differences in fidelity here can only be entrenched by higher quality or larger scale data, for they are a consequence not of the data or its sampling but of the mismatch between the complexity of the data and the flexibility of the statistical model.
Fig. 2
Fig. 2. Causal modelling of treatment—conditional outcomes in stroke.
Directed acyclic graph of the modelled causal relations between brain lesions and functional anatomy—a map of disrupted functions—and between treatment receipt and physiological anatomy—a map of treatment responsiveness—in generating the observed outcome. The lesion anatomical representation (lesion or disconnectome) interacts with the functional substrate to generate a data-driven functional disruption map. In parallel, the treatment allocation policy interacts with the physiological substrate (microarray RNA transcription or neurotransmitter receptor data) to generate a data-driven treatment responsiveness map. These two spatial maps intersect to generate the patient outcome, modulated by the magnitudes of recovery and treatment effects. The relationships are modelled to be corrupted by varying degrees of observable or unobservable confounding due to non-random treatment allocation, enabling quantification of their impact on the fidelity of inferred optimal treatment.
Fig. 3
Fig. 3. Semi-synthetic ground truth synthesis (upper panel).
Schematic of the process of semi-synthetic ground truth generation from lesions or disconnectomes, given meta-analytic maps of brain functional organization and physiology. Diffusion weighted magnetic resonance images were obtained from patients with confirmed acute ischaemic stroke. Each image volume was non-linearly transformed into Montreal Neurological Institute (MNI) template space, facilitating voxel-based comparisons between different lesioned images and with meta-analytic functional and physiological maps. A binary ischaemic mask was automatically segmented from each image, and used to simulate real-world individual-level variability of functional deficits and treatment responses. The overlap between each lesion and each of 16 meta-analytic functional grey matter networks, transformed into MNI space, was used to generate plausible synthetic functional deficits (lesion–deficit simulation). The anatomical territory associated with each functional network was further subdivided by transcriptome or receptome distribution data into two subregions, variably responsive to different interventions, furnishing treatment effect heterogeneity. A plausible anatomically determined ground truth for treatment responsiveness is thereby established, enabling explicit quantification of the fidelity in inferring the optimal treatment. The resulting semi-synthetic data comprise stroke phenotype representations, associated functional deficits, and the designated optimal treatment for each patient simulation. Virtual interventional trials (lower panel). We used Monte Carlo methods to simulate a large number of virtual trials across the full set of modelled lesion–deficit relationships, treatment responsiveness, and treatment allocation policies. For each functional network, all patients with corresponding deficits were recruited to virtual trials in which they receive one of two treatments. At least one of these was determined to be truly effective. Non-random treatment allocation as may occur in an observational setting was simulated using a confounding hyperparameter, ranging from 0 (randomized) to 1 (treatment selection based strongly upon patient phenotype). A patient’s response to a given treatment was dependent upon two sources of probabilistic noise: treatment effect, P(responsetrulysusceptible), and recovery effect, P(spontaneousresponse), independent of treatment received and responsiveness. These sources of noise are always present to some degree in any trial, randomized or observational. Within 10-fold cross-validation, prescriptive models were fitted using the training set, with quantified noise and confounding, for the objective of retrieving the optimal treatment, to each individual patient. The model was evaluated using a held-out test set, for lesion representations, disconnectome representations, functional networks, genetic expression-derived treatment responsiveness subnetworks, and receptor distribution-derived treatment responsiveness subnetworks, across the ranges of confounding, treatment effect and recovery effect.
Fig. 4
Fig. 4. Functional ground truths.
Functional grey matter parcellation dendrogram, showing agglomerative voxel-based clustering based upon association distances between voxels in their functional distributions. Visualizations of functional groupings at various thresholds up to 16 are shown on the right, displaying the grey matter functional hierarchy. From the 16-network parcellation, the archetypal terms associated with each group are shown below the dendrogram, with consistency of colours throughout.
Fig. 5
Fig. 5. Lesion (upper panel) and disconnectome (lower panel) anatomical distributions.
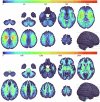
Axial slices showing the coverage in voxel-based summation of binary ischaemic maps of lesions (upper), and the summation of binarized disconnectome distributions (p > 0.5) associated with each of the lesions (lower), showing coverage across the brain. For both representations, N = 4119.
Fig. 6
Fig. 6. Prescriptive performance with richly expressive lesion representations.
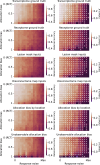
Balanced accuracy of treatment recommendation (left panel column, see Supplementary Tables 4–8 and Supplementary Figs. 75–82 for full descriptions), and statistical comparison against a simple vascular baseline, anterior or posterior vascular territories (right panel column), using a two-sided independent sample t-test. A filled circle indicates significantly higher performance for the expressive representation, and an unfilled circle significantly higher performance for the baseline model (using a Benjamini–Hochberg corrected critical value for 0.05 significance level). An ‘x’ indicates simulation conditions with insufficient class balance to permit prescriptive model fitting (e.g., because there are no non-responders). The upper two panel rows show performance averaged across the criteria for treatment responsiveness (transcriptome or receptome); the central two panel rows across lesion input representation type (lesion masks or disconnectomes); and the lower two panel rows across allocation confounding observability (location-based or unobservable). The optimal expressive representation is shown to be non-inferior to simple vascular territories at informing prescription across almost the full landscape of observational conditions, and superior in the vast majority. See Supplementary Fig. 83 for respective PEHE plots.
Fig. 7
Fig. 7. Prescriptive performance with richly expressive lesion representations, stratified according to functional deficit category.
Balanced accuracy of treatment recommendation, stratified according to the modelled functional deficit (see Supplementary Tables 4–8 & Supplementary Figs. 75–82 for full descriptions), and averaged across all simulation conditions. The right column shows Cohen’s d-effect size when comparing prescriptive performance using the optimal representation against a simple vascular baseline. A filled circle indicates superior performance for the optimal representation, according to a two-sided independent sample t-test, beyond the Benjamini–Hochberg corrected critical value for 0.05 significance level; an unfilled circle indicates superior performance for the simple vascular baseline correspondingly. The full anatomical–physiological modelling framework is visualized in Supplementary Figs. 11–74 for receptome and transcriptome, respectively. The advantage in prescriptive performance for the richly expressive approach is shown to generalize across modelled functional deficits as well as data conditions defined by outcome response noise and treatment allocation confounding. See Supplementary Fig. 84 for respective PEHE plot.

References

    1. Deaton, A. & Cartwright, N. Understanding and misunderstanding randomized controlled trials. Soc. Sci. Med.210, 2–21 (2018). - PMC - PubMed
    1. Mulder, R. et al. The limitations of using randomised controlled trials as a basis for developing treatment guidelines. Evid. Based Ment. Health21, 4–6 (2018). - PMC - PubMed
    1. Rothwell, P. M. Subgroup analysis in randomised controlled trials: importance, indications, and interpretation. Lancet365, 176–186 (2005). - PubMed
    1. Luedtke, A. R. & van der Laan, M. J. Evaluating the impact of treating the optimal subgroup. Stat. Methods Med. Res.26, 1630–1640 (2017). - PMC - PubMed
    1. Kessler, R. C., Bossarte, R. M., Luedtke, A., Zaslavsky, A. M. & Zubizarreta, J. R. Machine learning methods for developing precision treatment rules with observational data. Behav. Res. Ther.120, 103412 (2019). - PMC - PubMed

LinkOut - more resources