. 2025 Oct 16;16(1):9200.
doi: 10.1038/s41467-025-64245-w.

Limitations of acyclovir and identification of potent HSV antivirals using 3D bioprinted human skin equivalents

Affiliations

Limitations of acyclovir and identification of potent HSV antivirals using 3D bioprinted human skin equivalents

S Tori Ellison et al. Nat Commun. .

Abstract

Herpes simplex virus (HSV) infection poses global public health concerns with lifelong impacts. Acyclovir, the standard therapy, has limited efficacy in preventing subclinical shedding, and drug resistance occurs in immunocompromised patients, highlighting the need for novel therapeutics. Here we show that acyclovir is significantly less effective in skin-derived keratinocytes than donor-matched fibroblasts. Using 3D bioprinted human skin equivalents (HSEs) in a 96-well plate format, we have screened 738 compounds with broad targets and mechanisms of action, identifying potent antivirals, including 23 known or experimental HSV treatments. Unlike acyclovir, antivirals against HSV helicase/primase or host replication pathways display similar potency across cell types and donor sources in both 2D and 3D models. The reduced potency in keratinocytes may explain acyclovir's limited clinical efficacy. Our 3D bioprinted HSE assay platform enables the integration of patient-derived cells early in drug development and offers a physiologically relevant approach for HSV drug discovery.


Conflict of interest statement

Competing interests: The authors declare no competing interests.

Figures

Fig. 1
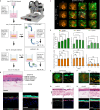
Fig. 1. Acyclovir potency in donor-derived primary keratinocytes and fibroblasts and in Vero cells.
A Punch biopsies from six donors were collected and dissociated by enzymatic and mechanical processes (Created in BioRender. Hayman, I. (2025) https://BioRender.com/fmeng2t). B Live-cell images of HSV-1-GFP infected Vero cells (purple), keratinocytes (blue), and fibroblasts (green) were taken every two hours. Dotted lines represent individual donors, solid lines represent averages (N = 3). C Time until HSV-encoded GFP was first detected in each cell type. (*** P < 0.001, two-tailed unpaired T test, df = 42.47, keratinocytes (N = 30), fibroblasts (N = 18), and Vero cells (N = 5)). D Doubling time for virus-encoded GFP fluorescence in 2D monoculture; a value of 1 means one doubling per hour. All biological replicates are plotted by donor. Statistics were determined by five (keratinocytes) or three (fibroblast) averaged biological replicates in six donors. Five biological replicates were averaged for Vero cells. Keratinocytes were compared to fibroblasts by two-tailed paired T test, P = 0.001, df = 5. Keratinocytes compared to Vero by a two-tailed unpaired student’s T test, P = 0.004–0.025 for df = 5 to 2. E Average IC50 values for each donor and cell type (*** P < 0.001, * P = 0.022, linear mixed model accounting for dependent structure of multiple donors); analysis included five (keratinocytes) or three (fibroblast) averaged biological replicates in six donors. Five biological replicates were averaged for Vero cells. F Dose-response curve of acyclovir in Vero cells (purple), keratinocytes (blue), and fibroblasts (green). Solid lines represent averages, shaded region represents standard deviation. G Representative live cell images of keratinocytes, fibroblasts, and Vero cells infected with GFP-expressing HSV-1 and then treated with acyclovir at the specified doses were selected from at least three biological replicates (Scale bar 500 µm). C, D, F, E Plotted values are mean ± standard deviation. Source data provided for (B–F).
Fig. 2
Fig. 2. 3D bioprinted HSE assay development and validation.
A Dermis equivalents were 3D printed onto the apical side of transwell inserts using the RegenHU 3D Discovery bioprinter (image courtesy of RegenHU). Keratinocytes were pipetted onto the apical surface of the dermis. In the submerged model, the tissues were infected at the apical surface. In the ALI model, tissues were brought to ALI and then infected at the basolateral surface (Created in BioRender. Ellison, S. (2025) https://BioRender.com/cege2fm). B H&E and IHC representative images of differentiated ALI tissues (N = 2). Loricrin (red) and filaggrin (cyan) expressed in stratum granulosum and stratum corneum, respectively, and K10 (cyan) and K14 (red) identify keratinocytes in the suprabasal and basal layer of the epidermis, respectively, and Hoechst nuclear stain in blue, (scale bars 20 μm and 50 µm). C Submerged tissues were infected at various MOI and then imaged at specified times. Fibroblasts express tdTomato (orange) while infected cells express GFP (green) (scale bar 1 mm). D GFP and tdTomato signal at each MOI and timepoint (N = 6 biological replicates, *** P < 0.001, **** P < 0.0001 by ordinary one-way ANOVA). We noted a decrease in GFP and tdTomato signal over time due to photobleaching. To correct for this reduction in fluorescence signals, we controlled each tested MOI to the proper uninfected control. Data is represented by mean values with error bars ± SD. [24 h: P1 = 0.0002, P10 < 0.001] [48 and 72hrs all P < 0.001]. Representative maximum projection images (N = 2) of infected tissues from the top and side view display viral infection (green) and the healthy fibroblasts (red) in the submerged (E) and ALI (F) tissues. H&E and IHC staining of uninfected or infected submerged (G) or ALI (H) models. (scale bars 50 µm). Source Data provided for (D).
Fig. 3
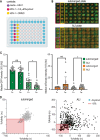
Fig. 3. Primary screen of compound library in 3D bioprinted assay platform.
A Plate layout for compound screen. B Representative images from primary screen of submerged and ALI models. Controls are highlighted in boxes with colors corresponding to part (A). C Two-tailed Wilcoxon two-sample analysis of GFP intensity (left) and tdTomato intensity (right) of the median of the six negative control wells (HSV-1 + DMSO) across N = 16 plates per replicate, * P = 0.023 and 0.012 for GFP and tdTomato, respectively). Bars represent average with error bars as standard deviation. D Correlation plots of the two replicates for the primary screen of compounds. The red shaded box represents compounds that were selected as hits for re-testing if they reduced GFP expression (%Activity) by at least 15% in either replicate or model (left submerged, right ALI). Acyclovir was included in the collection and denoted by a cyan circle. Source Data provided for (C) and (D).
Fig. 4
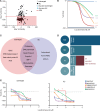
Fig. 4. Dose response of candidate antivirals in 3D bioprinted assay platform.
A Correlation plot of Max %Activity (maximum reduction in GFP) vs. Max %Viability (maximum reduction in tdTomato) of 106 ‘hits’ tested in dose response. Top candidate antivirals (50% or greater reduction in GFP) that did not kill over 50% of tdTomato transduced fibroblasts are identified by the red shaded box. B Schematic illustrating %Activity dose response profiles of different Concentration-Response Curve classes (CRC). C Venn diagram showing divergent and coinciding targets for 41 top candidate antivirals in both submerged and ALI models. D Schematic of compounds selection from 738 compounds in the primary screen to 106 ‘hits’ tested in dose-response to 41 selected candidates and 11 top candidates selected to move forward. Of the 41 selected candidates, 23 are current or experimental HSV treatments. E Dose response curves of candidate antivirals in “ciclovir” family, known to treat HSV-1, in submerged and ALI models (N = 1). Source Data provided for (A) and (E).
Fig. 5
Fig. 5. Top candidate antiviral potency, efficacy, and cytotoxicity in 3D bioprinted HSE.
A Average dose-response curves for the 11 top candidate antivirals for submerged (blue) and ALI (green) models. B IC50 values for each top candidate antiviral compared between submerged (blue) and ALI (green) models. C Maximum inhibition for each top candidate antiviral compared between submerged (blue) and ALI (green) models. Statistical significance was determined Wald tests based on linear models with multiple comparison adjustment (*** P < 0.001, ** P < 0.01, * P < 0.05) for (B) and (C). Refer to Supplementary Table 6 for specific P values. D CC50 dose response curves for 11 top candidate antivirals. All data is plotted as the average of three biological replicates (N = 3), error bars represent standard deviation. Source Data provided for all panels.
Fig. 6
Fig. 6. Candidate antiviral potency, efficacy, and cytotoxicity in donor-derived primary keratinocyte and fibroblast monocultures.
A Dose-response curves for the 11 top candidate antivirals compared to acyclovir (ACV) (keratinocytes blue and gray, respectively; fibroblasts green and black, respectively). B IC50 values for each top candidate antiviral compared between keratinocytes (blue) and fibroblasts (green). Striped bars (FMP, VRD) indicate candidate antivirals that failed to reduce GFP expression by at least 50% consistently. C Maximum inhibition for each top candidate antiviral is compared between keratinocytes (blue) and fibroblasts (green). Statistical significance was determined by Wald tests based on linear mixed models with multiple comparison adjustments accounting for the dependent structure of multiple donors (*** P < 0.001, ** P < 0.01, * P < 0.05) for (B) and (C). Refer to Supplementary Table 6 for specific P values. D CC50 dose-response curves for all twelve candidate antivirals compared to their respective IC50 to IC80 dose ranges. Keratinocyte data is from 20HPI (gray), while fibroblast data is from 48HPI (red). All data is plotted as the average of three replicates in three distinct donors (N = 9), error bars represent standard deviation. Source data provided for all panels.
Fig. 7
Fig. 7. Comparison of 3D and 2D models in testing antiviral candidates.
A Pairwise comparisons of IC50 values for candidate antivirals in the four models tested. B Pairwise comparisons of CC50 values for candidate antivirals in the four models tested. C Fold change was determined by dividing the IC50 value of each candidate antiviral in keratinocytes by the IC50 of the same candidate antiviral in submerged models. D Fold change was determined by dividing the IC50 value of each candidate antiviral in fibroblasts by the IC50 of the same candidate antiviral in ALI models. E IC50 values for each candidate antiviral were pooled (keratinocytes and fibroblasts, submerged and ALI), then IC50 values for candidate antivirals in 2D were divided by IC50 values in 3D. C, D, E Green bars indicate candidate antivirals that were more potent in 3D, while blue bars indicate candidate antivirals that are potent in 2D. Data for 2D (N = 9) and 3D (N = 3) is reported as averages, error bars are standard deviation. Source data provided for all panels.
Fig. 8
Fig. 8. Generation of 3D bioprinted HSE using adult donor-derived keratinocytes.
H&E and IHC staining of commercial neonatal or adult-derived bioprinted HSE in submerged (A) and ALI (B) models (scale bar 50 μm). Comparison of calculated IC50 in submerged (C) and ALI (D) models for top candidate antivirals. Neonatal data is plotted as an average of three biological replicates (N = 3), error bars are standard deviation. Adult data has an N = 1 and does not include error bars. Source Data provided for (C) and (D).

References

    1. Looker, K. J. et al. Global and regional estimates of prevalent and incident herpes simplex virus type 1 infections in 2012. PLoS One10, e0140765 (2015). - PMC - PubMed
    1. Looker, K. J. et al. Global estimates of prevalent and incident herpes simplex virus type 2 infections in 2012. PLoS One10, e114989 (2015). - PMC - PubMed
    1. Gupta, R., Warren, T. & Wald, A. Genital herpes. Lancet370, 2127–2137 (2007). - PubMed
    1. James, S. H. & Kimberlin, D. W. Neonatal herpes simplex virus infection. Infect. Dis. Clin. North Am.29, 391–400 (2015). - PubMed
    1. Corey, L., Wald, A., Celum, C. L. & Quinn, T. C. The effects of herpes simplex virus-2 on HIV-1 acquisition and transmission: a review of two overlapping epidemics. J. Acquir Immune Defic. Syndr.35, 435–445 (2004). - PubMed

LinkOut - more resources