Observational Study
. 2025 Oct;31(10):3542-3552.
doi: 10.1038/s41591-025-03889-z. Epub 2025 Oct 16.

Characterizing the physiology of circulatory arrest in humans

Affiliations
Observational Study

Characterizing the physiology of circulatory arrest in humans

Jordan D Bird et al. Nat Med. 2025 Oct.

Abstract

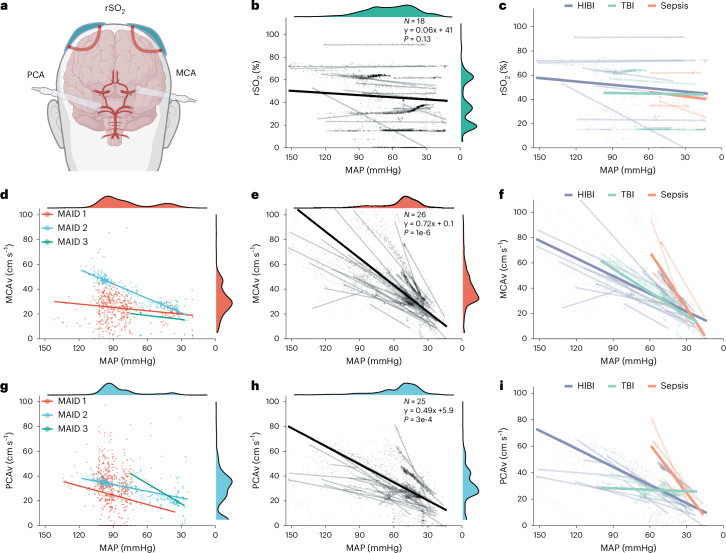
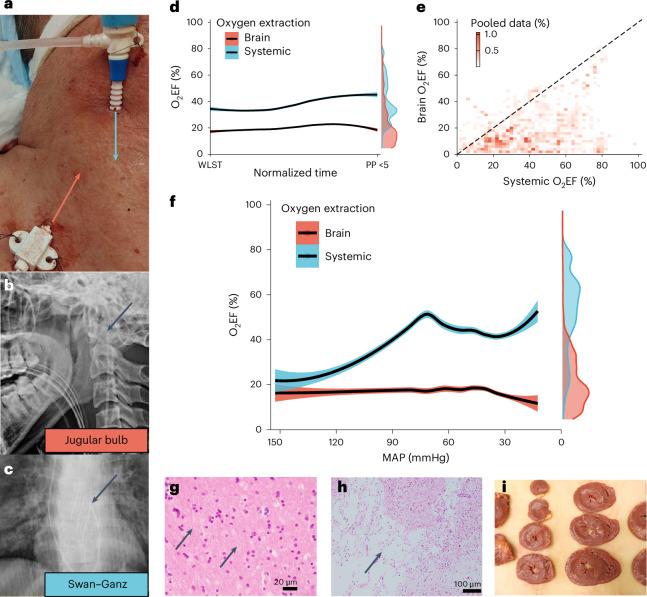
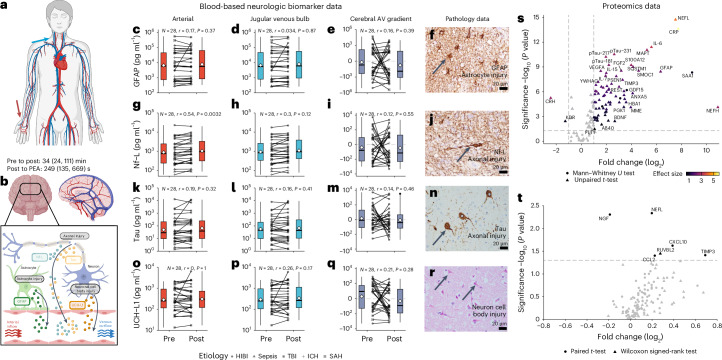
The dying process from circulatory arrest is an underexplored domain in humans and has transdisciplinary pertinence. Here we conducted a prospective, observational cohort study of the dying process in 39 adults, with a multimodal assessment of cerebrovascular and cardiovascular physiology. We found that cerebral blood velocities and brain tissue oxygen tensions ceased before systemic hemodynamics. The brain exhibited diffusion limitation of oxygen extraction during the dying process compared with extracranial tissues. Anterior and posterior brain circulations had differences in timing of cessation of circulation and physiologic responses during the dying process. Blood-based neurologic biomarkers from the brain did not change during the associated ischemia related to the dying process. Heart pathology was associated with the length of the dying process. This study provides proof-of-concept of an in vivo human model to comprehensively investigate severe cerebral ischemia and the human dying process. ClinicalTrials.gov registration: NCT06130033 .


Conflict of interest statement

Competing interests: S.D. is an unpaid volunteer for the Canadian Donation and Transplantation Research Program. M.S.S. is an unpaid volunteer for the Organ Donation and Transplantation Research Foundation of British Columbia since fall 2024. Both organizations provided pilot grant funding in April 2023 to supplement the research. While grant funding was provided, the funders had no role in the conceptualization, design, data collection, analysis, decision to publish or preparation of the manuscript. The remaining authors declare no competing interests.

Figures

Fig. 1
Fig. 1. Timing of physiology throughout the dying process until circulatory arrest with pathology correlates.
a, WLST was undertaken by extubation with heterogeneous timing until PEA and EA. SBP of <60 mm Hg (white dots) denotes when blood-based brain biomarkers were acquired in each study patient (M, male; F, female). The last recorded breath (green diamonds) was recorded to the minute in each study patient with a bedside assessment. Study patients who underwent donation after circulatory death are denoted with an asterisk. b, Study patients showed heterogeneity in whether the MCAv or PCAv ceased first. c, In all study patients, intracranial blood flow velocities (MCAv or PCAv) ceased before PEA and EA. The last intracranial vessel that stopped giving a velocity signal was used for each study patient so that both anterior and posterior circulations had cessation of flow for comparison to PEA and EA. d, After death determination, the time until autopsy was recorded. eg, Macrovascular (e and f), microvascular (g) and neural (h) injury in the brain, as determined from autopsies, are probably contributing factors to the heterogeneity of the dying process: examples of macroscopic postmortem brain evaluations include a lethal tumor-associated acute brainstem hemorrhage (e) and a thrombotic occlusion of the left-middle cerebral artery in the circle of Willis and not the other major cerebral arteries (f). The inset shows the left-middle cerebral artery at higher magnification (f). Notable arteriolosclerosis (that is, small vessel disease) were frequent chronic changes identified in this cohort (N = 15; 47%) (g). Scale bar, 50 µm (g). Summary data are presented as medians with IQRs. EA, electrical asystole; HIBI, hypoxic-ischemic brain injury; ICH, intracerebral hemorrhage; MAID, medical assistance in dying; PEA, pulseless electrical activity; SAH, subarachnoid hemorrhage; TBI, traumatic brain injury. Source data.
Fig. 2
Fig. 2. Timing of intraparenchymal neuromonitoring physiology throughout the dying process until circulatory arrest with pathology correla.
ac, In three patients with post-cardiac arrest hypoxic–ischemic brain injury, intraparenchymal neuromonitoring was undertaken for direct physiologic clinical monitoring of the brain. Individual time series data before WLST and throughout the dying process are shown for three HIBI intraparenchymal cases: 1 s data were binned into 10 s epochs and are presented as means with s.d. (gray ribbons). Pre-oxygenation before withdrawal was administered in one study patient (c). PbtO2 ceased (vertical dotted gray line) before PEA (vertical dashed black line) in all study patients. dl, Demonstration of one HIBI patient with bihemispheric intraparenchymal neuromonitoring. d, Placement of bilateral cranial bolts. e, Positioning of bilateral transcranial Doppler ultrasound. e,i, Neuromonitoring also consisted of transcranial Doppler ultrasound of the anterior and middle cerebral arteries. f, Before WLST, computed tomography confirmed placement of bilateral intraparenchymal neuromonitoring. g, Computed tomography perfusion imaging showed the brain was globally and symetrically perfused before WLST. h, Magnetic resonance imaging prior to WLST showed bilateral cortical restricted diffusion on diffusion weighted imaging. i,j,l Bilateral intraparenchymal neuromonitoring was used for the measurement of bilateral PbtO2 and cortical electrical activity via depth electrode (l) and contralateral intracranial pressure (i) and microdialysis (j). Following WLST, bilateral PbtO2 and ACAv, and MCAv ceased before PEA and EA (i) and electrographic activity showed no activity from the depth electrodes (l). ACAv transiently rose following cessation of PbtO2, consistent with increased vascular resistance from a loss of flow downstream and the backpropagating nature of cessations in flow (i) and it exhibited stochastic changes in velocity consistent with higher resistance (k). Microdialysis measures demonstrated important changes in cellular function and metabolism throughout the dying process (j). The dashed white lines denote the cessation of PbtO2, ACAv, MCAv and pulse pressure (i). Box marked K indicates the area shown as a blown up image in k. ACAv, anterior cerebral artery blood flow velocity; CPP, cerebral perfusion pressure; DBP, diastolic blood pressure; ICP, intracranial pressure derived from the MCAv waveform; LP ratio, lactate:pyruvate ratio; MAP, mean arterial pressure; MCAv, middle cerebral artery blood flow velocity; PbtO2, brain tissue oxygen tension; PEA, pulseless electrical activity; SBP, systolic blood pressure; WLST, withdrawal of life-sustaining treatments; R, right; L, left. Source data.
Fig. 3
Fig. 3. Physiologic responses of the brain to progressive hypotension.
a, Noninvasive cerebrovascular monitoring consisted of rSO2 (green), MCAv (red) and PCAv (blue). b,c,e,f,h,i, Random slope and random intercept two-sided linear mixed-effects models demonstrating lines fit to individual patient data and group data in the critically ill patient group for rSO2 (b,c), MCAv (e,f), and PCAv (h,i) as functions of decreasing MAP. c,f,i, The individual patient lines are fit to minimize residuals. Study patients in the critically ill group were stratified by etiology to determine how responses may differ for rSO2 (c), MCAv (f) and PCAv (i). d,g, As a non-acutely brain injured control group, the slope responses for MAID patients were assessed for the MCAv (d) and PCAv (g). The shallower slope responses in the MAID patient cohort may be partly attributable to sedative administration that would reduce cerebral metabolic activity. HIBI, hypoxic-ischemic brain injury; MAID, medical assistance in dying; MAP, mean arterial pressure; MCAv, middle cerebral artery blood flow velocity; PCA, posterior cerebral artery blood flow velocity; rSO2, regional cerebral oxygen saturation; TBI, traumatic brain injury. Panel a created with BioRender.com. Source data.
Fig. 4
Fig. 4. Comparisons between brain and systemic O2EF in critically ill humans.
ac, The relationship between brain O2EF and systemic O2EF as a function of progressive hypotension and hypoxemia in the 16-patient cohort in whom pulmonary artery catheters (that is, Swan–Ganz catheters) were placed. Simultaneous jugular venous bulb and pulmonary artery catheter placements in the jugular vein (a), with X-ray confirmation of jugular bulb (b) and pulmonary artery (c) catheter placements. d, Brain O2EF remained low from WLST to circulatory arrest while systemic O2EF was elevated. e, Pooled data from all study patients normalized to equal data contribution found that brain O2EF was consistently lower than systemic O2EF despite no consistent relationship between brain and systemic O2EF. The dashed black line is the line of identity, suggesting similar extractions between brain and systemic circulations. f, This rise in systemic, but not brain, O2EF is a function of progressive hypotension that arose during circulatory arrest. Data are presented as weighted localized regression with 95% confidence intervals (d and f). This discordance between brain and systemic O2EF responses may in part be explained by existing brain injury and potential sedative administration during the dying process. g,h, Some pathological examinations (N = 9; 28%) exhibited subcortical white matter that was relatively unremarkable (g) while others (N = 23; 72%) exhibited ischemic infarcts (h), pan necrosis or other vascular pathology. Scale bars, 20 and 100 µm (for g and h, respectively). i, Hearts were assessed for anatomical pathology to identify macroscopic changes in heart morphology that may contribute to the heterogeneity of dying process. MAP, mean arterial pressure; O2EF, oxygen extraction fraction; PP, pulse pressure; WLST, withdrawal of life-sustaining treatment. Source data.
Fig. 5
Fig. 5. Comparison of blood-based neurologic biomarkers taken before WLST and during the dying process.
a, Blood-based neurologic biomarkers were taken from the radial artery and internal jugular vein to allow for arteriovenous gradient analysis across the cerebral circulation. Timing data are presented as medians (Q1, Q3) for the IQR. b, Biospecimens were collected before WLST (pre) and from when SBP was <60 mm Hg (post). Biomarkers were analyzed for common markers of astrocyte, axonal and neuron cell body injury. cr, Arterial (c, g, k and o), jugular venous (d, h, l and p) and cerebral arteriovenous (AV) gradients (e, i, m and q) were pairwise compared using two-way Wilcoxon signed-ranks tests and Wilcoxon effect sizes. These data are presented on a log10 scale (ce, gi, km and oq). The box plots are presented as the five-number summary (minima, Q1, median, Q3 and maxima) with the white diamond on top of each box plot representing each group mean. Only arterial Nf-L was elevated following ischemia of the dying process (g). Subsequent postmortem analysis of the brain confirmed presence of astrocyte (f), axonal (j and n) and neuron cell body (r) injury. Scale bars, 20 µm. Many brain autopsies had substantial amounts of neurons with eosinophilic cytoplasm and shrunken nuclei typical of cases with ischemic brain injury (r). s, Arterial plasma proteomics for the critically ill patient cohort and healthy controls were assessed for normality by Shapiro–Wilkes tests then compared using either two-way unpaired t-tests (normal distribution) or two-way Mann–Whitney U tests (non-normal distribution) then corrected for the false discovery rate. Arterial plasma proteomic analysis indicated severe central nervous system injury in the critically ill patient cohort compared with healthy controls before WLST. t, Arterial plasma biomarker changes from pre to post in the critically ill patient group were assessed for normality by Shapiro–Wilkes tests then compared using either two-way paired t-tests (normal distribution) or two-way Wilcoxon signed-rank tests. Arterial plasma biomarkers were relatively unchanged throughout the dying process in the critically ill patient cohort. The effect size was calculated as either Cohen’s d (normal distribution) or Wilcoxon (non-normal distribution) effect sizes (s and t). AV, arterial-venous; GFAP, glial fibrillary acidic protein; Nf-L/NEFL, neurofilament light chain; PEA, pulseless electrical activity; UCH-L1, ubiquitin carboxyl-terminal hydrolase L1. Panels a and b created with BioRender.com. Source data.
Fig. 6
Fig. 6. Physiologic responses to the last agonal breath during the dying process in critically ill humans.
a, Agonal breathing was identified at the bedside and from the pulmonary artery pressure (PAP) waveform in the 16-patient cohort who had pulmonary artery catheters placed (that is, Swan–Ganz catheters). The white arrows denote the timing of agonal breaths. b, Increases in PAP and CVP following agonal breathing led to transient increases in PCAv. cn, The response of PAP (c), CVP (d), MAP (e), PP (f), MCAv (g), PCAv (h), SjvO2 (i), central mixed venous saturation of oxygen (SvO2) (j), peripheral saturation of oxygen (SpO2) (k), rSO2 (l), brain O2EF (m) and systemic O2EF (n). Data 3 s before agonal breathing were averaged for a baseline to minimize the potential impact of previous agonal breaths. The red x-axis ticks at the top of each figure are the time after agonal breathing was initiated that the maximum value occurred in each study patient. The red y-axis ticks on the right of each figure are the maximum value each patient achieved in the 10 s following the agonal breath as a quantification for what possible maximum values were reached while not directly shown, with locally estimated scatter plot smoothing fitted lines. The red axis ticks were only recorded if there was a maximum value within the 10 s window. Responses that did not change throughout the 10 s window did not receive a tick mark. Statistical comparisons were made between the average baseline value from the preceding 3 s before the agonal breath to the maximum value during the subsequent 10 s period following agonal breathing via two-way paired t-tests. CVP, central venous pressure; MAP, mean arterial pressure; MCAv, middle cerebral artery blood flow velocity; O2EF, oxygen extraction fraction; PAP, pulmonary artery pressure; PCAv, posterior cerebral artery blood flow velocity; PP, pulse pressure; rSO2, regional cerebral oxygen saturation; SjvO2, jugular venous oxygen saturation; SpO2, peripheral oxygen saturation; SvO2, mixed central venous oxygen saturation. Source data.
Extended Data Fig. 1
Extended Data Fig. 1. Monitoring setup, methodology, and feasibility for data collection during the dying process.
Cerebrovascular (a) and cardiovascular (b) physiology were continuously monitored throughout the dying process. Cerebrovascular monitoring consisted of middle cerebral blood flow velocity (i) and posterior cerebral blood flow velocity (ii) via transcranial Doppler ultrasound, bilateral near-infrared spectroscopy pads (iii) for assessment of regional cerebral saturation of oxygen from the frontal lobe, and jugular venous bulb oximetry (iv). Cardiovascular monitoring consisted of pulse oximetry (v) on an upper extremity digit, an in situ radial artery catheter (vi), a pulmonary artery catheter (vii) and echocardiogram telemetry (vii) for electrical activity of the heart. Substantial monitoring equipment was brought into the room for each study patient (c). Transcranial Doppler ultrasound (d) gave signal intensities for the MCA (i) and PCA (ii) with subsequent loss of signal throughout the dying process. The experimental protocol consisted of the patient being extubated to room air as the process for withdrawal of life-sustaining measures, followed by the dying process, and subsequent death determination at pulseless electrical activity which was defined as a pulse pressure <5 mmHg per Canadian guidelines (e). Paired serum and plasma blood samples were taken prior to withdrawal of life-sustaining measures and once systolic blood pressure was less than 60 mmHg. Pathology examination was performed for the brain, heart, and spinal cord in subsequent hours and days following withdrawal of life-sustaining measures. Feasibility of multimodal data collection prior to, during, and following the dying process (f). Study patients are stratified by cohort (critically ill humans, medical assistance in dying) and listed in chronological order of data collection (F). An asterisk (*) denotes an ethics amendment allowed for instrumentation of pulmonary artery catheters in the critically ill patient cohort after enrollment of patient 10. Abbreviations: BP, blood pressure; CI, cardiac index; CO, cardiac output; ECG, electrocardiogram; HIBI, hypoxic ischemic brain injury; HR, heart rate; ICH, intracerebral hemorrhage; ICM + , clinical software from the University of Cambridge; MAID, medical assistance in dying; MCAv, middle cerebral blood flow velocity; NIRS, near-infrared spectroscopy; PAC, right heart pulmonary artery catheter; PAP, pulmonary artery pressure; PCAv, posterior cerebral blood flow velocity; rSO2, regional cerebral saturation of oxygen; SAH, subarachnoid hemorrhage; SjvO2, jugular venous saturation of oxygen; SpO2, peripheral oxygen saturation; SvO2, mixed venous oxygen saturation; T, temperature in Celsius; TBI, traumatic brain injury; WLST, withdrawal of life-sustaining treatment. Panels a, b, and e were created with BioRender.com. Source data
Extended Data Fig. 2
Extended Data Fig. 2. Relationships between sedative administration during the dying process and the resultant length of dying process.
Statistical analysis was determined using two-sided Spearman rho correlations (rs). The administration of midazolam (a-c) and hydromorphone (d-f) boluses were not related to the length of the dying process. Abbreviations: CBv, cessation of cerebral blood velocities; PEA, pulseless electrical activity defined as a pulse pressure <5 mmHg; WLST, withdrawal of life-sustaining treatment. Source data
Extended Data Fig. 3
Extended Data Fig. 3. Normalized physiologic signals from WLST to death determination.
Local polynomial regressions (a-g) were fit to individual patient data (grey lines). Individual patient data was weighted equally within-patient for the local polynomial regression indicative of the group response (black line). Grey distribution plots denote the spread of data for where most data within each variable was located for magnitude. Abbreviations: MAP, mean arterial pressure; MCAv, middle cerebral artery flow velocity; O2EF, oxygen extraction fraction; PCAv, posterior cerebral artery; rSO2, regional cerebral oxygen saturation; SjvO2, jugular venous oxygen saturation; SpO2, peripheral oxygen saturation. Source data
Extended Data Fig. 4
Extended Data Fig. 4. Physiologic responses of the brain to progressive hypoxemia.
Random slope and random intercept two-sided linear mixed effects models demonstrating lines fit to individual patient data and group data for MCAv (a), PCAv (b), rSO2 (c), and SjvO2 (d) as functions of decreasing SpO2. Individual patient lines are fit to minimize residuals. Abbreviations: MAP, mean arterial pressure; MCAv, middle cerebral artery blood flow velocity; PCAv, posterior cerebral artery blood flow velocity; rSO2, regional cerebral saturation of oxygen; SjvO2, jugular venous saturation of oxygen. Source data
Extended Data Fig. 5
Extended Data Fig. 5. Individual comparisons of brain O2EF and systemic O2EF.
Individual patient responses to hypotension denote no relationship between the brain and systemic oxygen extractions. Abbreviations: HIBI, hypoxic ischemic brain injury; ICH, intracerebral hemorrhage; MAP, mean arterial pressure; O2EF, oxygen extraction fraction; SAH, subarachnoid hemorrhage; TBI, traumatic brain injury. Source data
Extended Data Fig. 6
Extended Data Fig. 6. Physiologic control data at time of biospecimen collection and relationships between changes in cerebral arteriovenous gradient of blood-based neurologic biomarkers and physiologic variables.
Biospecimens were collected prior to withdrawal of life-sustaining measures (pre) and from when systolic blood pressure <60 mmHg (post). Physiologic data from the time of biospecimen collection in the critically ill patient cohort was used to contextualize changes in hypotension and hypoxemia elicited by the dying process (a-d). Boxplots are presented as the five-number summary (minima, Q1, median, Q3, maxima) with the white diamond on top of each boxplot representing group mean (a-d). Physiologic data was compared using two-way paired t-tests with Cohen’s d for effect sizes (a-d). Changes in cerebral arteriovenous gradients with hypotensive (e, g, i, k) and hypoxemic (f, h, j, l) burden were evaluated at the systolic blood pressure <60 mmHg timepoint in the critically ill patient cohort. Correlations were assessed with two-sided Spearman’s rho for blood-based brain biomarkers of GFAP (e, f), Nf-L (g, h), total Tau (i, j), and UCH-L1 (k, l). Abbreviations: AUC, area under the curve; GFAP, glial fibrillary acidic protein; MAP<65, mean arterial pressure less than 65 mmHg; Nf-L, neurofilament-light; SpO2, <90, peripheral oxygen saturation less than 90%; UCH-L1, ubiquitin C-terminal hydrolase L1. Source data
Extended Data Fig. 7
Extended Data Fig. 7. Individual plasma proteomic relationships.
Arterial (a) and cerebral arterial–venous gradient (b) differences in the plasma proteome were assessed between healthy controls and critically ill patients prior to WLST. Arterial differences in the plasma proteome from prior to WLST to SBP < 60 mmHg was assessed in critically ill patients (c). Data was analyzed on the NULISAseq™ CNS Disease Panel 120 on the ARGO™ HT platform. Data for comparisons between healthy controls and pre-WLST data (a, b) were compared using either two-sided unpaired t-tests or two-sided Mann Whitney U tests depending on whether data was normally distributed and their tests were not corrected for multiple comparisons as this was exploratory and transparent data presentation. Data for comparisons between pre-WLST data and post-WLST data (c) were compared using either two-sided paired t-tests or two-sided Wilcoxon Signed Rank tests depending on whether data was normally distributed and their tests were not corrected for multiple comparisons as this was an exploratory and transparency data collection. Abbreviations: NPQ, NULISA protein quantification; SBP, systolic blood pressure; WLST, withdrawal of life-sustaining treatment. Source data

References

    1. Sandroni, C., Cronberg, T. & Sekhon, M. Brain injury after cardiac arrest: pathophysiology, treatment, and prognosis. Intensive Care Med.47, 1393–1414 (2021). - PMC - PubMed
    1. Shemie, S. D. et al. A brain-based definition of death and criteria for its determination after arrest of circulation or neurologic function in Canada: a 2023 clinical practice guideline. Can. J. Anesth.70, 483–557 (2023). - PMC - PubMed
    1. Guidelines for the determination of death: report of the medical consultants on the diagnosis of death to the President’s Commission for the Study of Ethical Problems in Medicine and Biomedical and Behavioral Research. JAMA246, 2184 (1981). - PubMed
    1. Greer, D. M. et al. Determination of brain death/death by neurologic criteria: the World Brain Death Project. JAMA324, 1078 (2020). - PubMed
    1. Murphy, N. B. et al. Advancing the scientific basis for determining death in controlled organ donation after circulatory determination of death. Transplantation108, 2197–2208 (2024). - PMC - PubMed

Publication types

Associated data