Burden and risk factors of depression in seniors from 1990 to 2021: a multi-database study based on EMR mining methods
- PMID: 41107230
- PMCID: PMC12534459
- DOI: 10.1038/s41398-025-03636-5
Burden and risk factors of depression in seniors from 1990 to 2021: a multi-database study based on EMR mining methods
Abstract
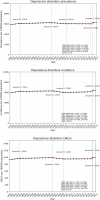
Depression in seniors is a growing public health concern worldwide. Despite the rising prevalence of depression in this demographic, comprehensive data on its burden and trends over an extended period remain limited. This study aims to assess the trends in the burden of depression among seniors from 1990 to 2021, utilizing the Global Burden of Diseases, Injuries, and Risk Factors Study (GBD) database, and to further explore the risk factors using China Health and Retirement Longitudinal Study (CHARLS) database and National Health and Nutrition Examination Survey (NHANES) database. We utilized data from the GBD 2021, reporting incidence and disability-adjusted life years (DALYs) per 100,000 population, average annual percentage change (AAPC), and risk factors at global, and regional levels. Trends were analyzed by age, sex, and social development index. Joinpoint regression identified significant changes in global trends. We established an interpretable machine learning (ML) model with high efficiency and robustness that identifies depression based on CHARLS (2015, 2018, &2020) and NHANES (2013-2020.3). We chose a best-performing eXtreme Gradient Boosting (XGB) with Genetic Algorithm (GA) for identification, and used SHapley Additive exPlanation (SHAP) to illustrate the potential risk factors. From 1990 to 2021, the overall global incidence of depression among seniors remained broadly stable (AAPC 0.01, 95% CI -0.07 to 0.08), although marked changes emerged in specific regions and population subgroups. The incidence of depressive disorders increased globally for males (AAPC 0.06 [95% CI -0.02 to 0.15]) while it decreased for females (AAPC -0.01 [95% CI -0.09 to 0.07]). Regional analysis showed the highest incidence rates in low-SDI countries, while middle-SDI countries experienced the most significant increases in the burden of depression (AAPC 0.25 [95% CI 0.17 to 0.34]). Risk factor analysis using machine learning models identified key predictors of depression in elderly populations in both China and the United States. The burden of depression among seniors has significantly shifted globally, with marked regional and demographic variations. These findings underscore the urgent need for targeted interventions, policy modifications, and early screening programs to address the rising burden of depression in this vulnerable age group. The use of advanced machine learning models provides valuable insights into the risk factors, facilitating the development of more effective and tailored intervention strategies.
© 2025. The Author(s).
Conflict of interest statement
Competing interests: The authors declare that they have no competing interests. Ethics statement: We did not take part in the participant recruiting since this analysis was based on the already-available data. As far as we are aware, no patients were involved in the planning, selection, or execution of the study.
Figures


References
-
- Institute for Health Metrics and Evaluation (IHME). Global Burden of Disease Study 2021 (GBD 2021) Burden by Risk 1990–2021 (Seattle, United States: IHME, 2021). https://ghdx.healthdata.org/record/ihme-data/gbd-2021-burden-by-risk-199....
-
- Friedman, JH, Hastie, T, Tibshirani, R. The elements of statistical learning. Vol. 1. (New York, NY: Springer, 2001).
-
- Lundberg SM, Lee SI. A unified approach to interpreting model predictions. Adv Neural Inf Process Syst. 2017;30:4765–74.
MeSH terms
LinkOut - more resources
Full Text Sources
Medical

