. 2025 Oct 17;15(1):417.
doi: 10.1038/s41398-025-03618-7.

Unraveling the brain expression of bdnf in a mouse model of anorexia nervosa

Affiliations

Unraveling the brain expression of bdnf in a mouse model of anorexia nervosa

Jingxian Cao et al. Transl Psychiatry. .

Abstract

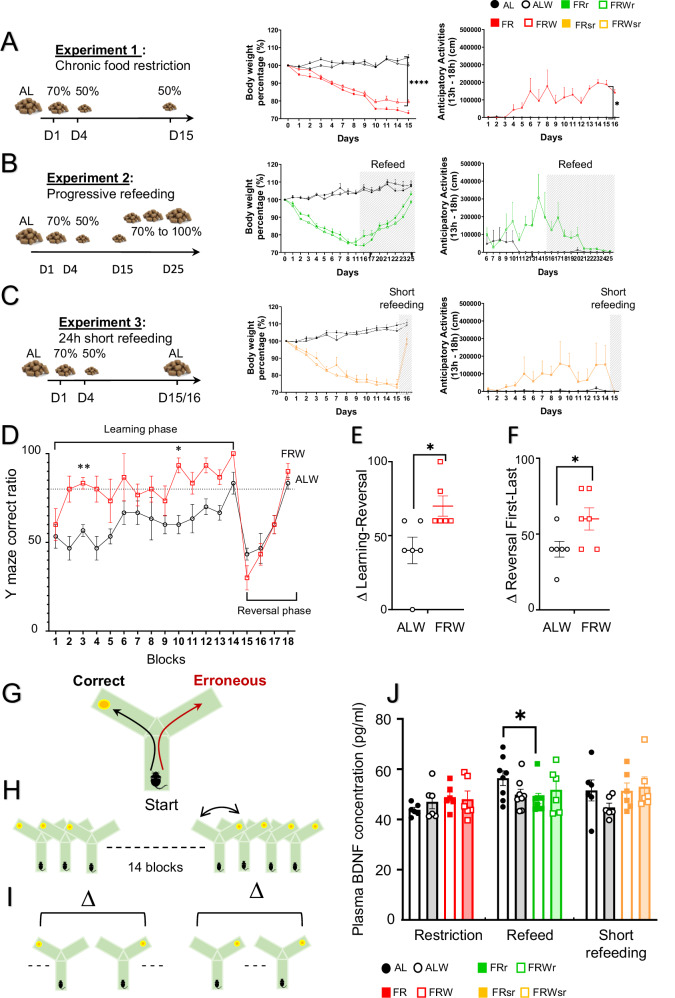
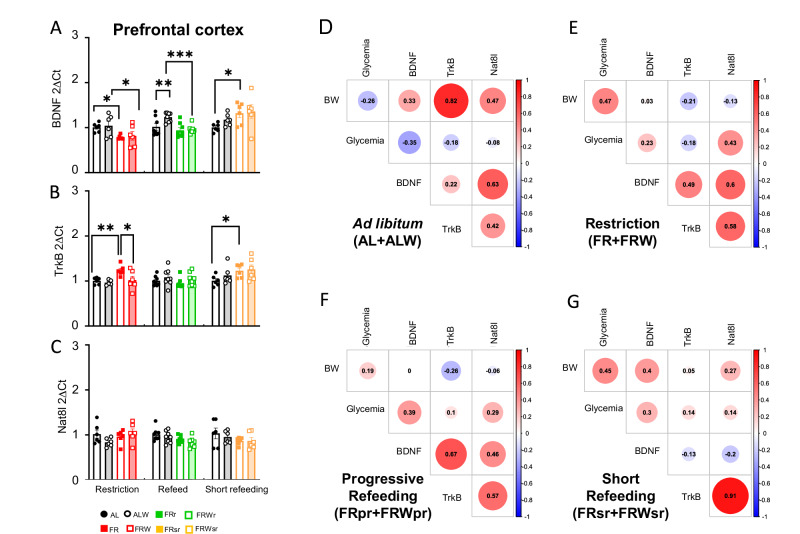
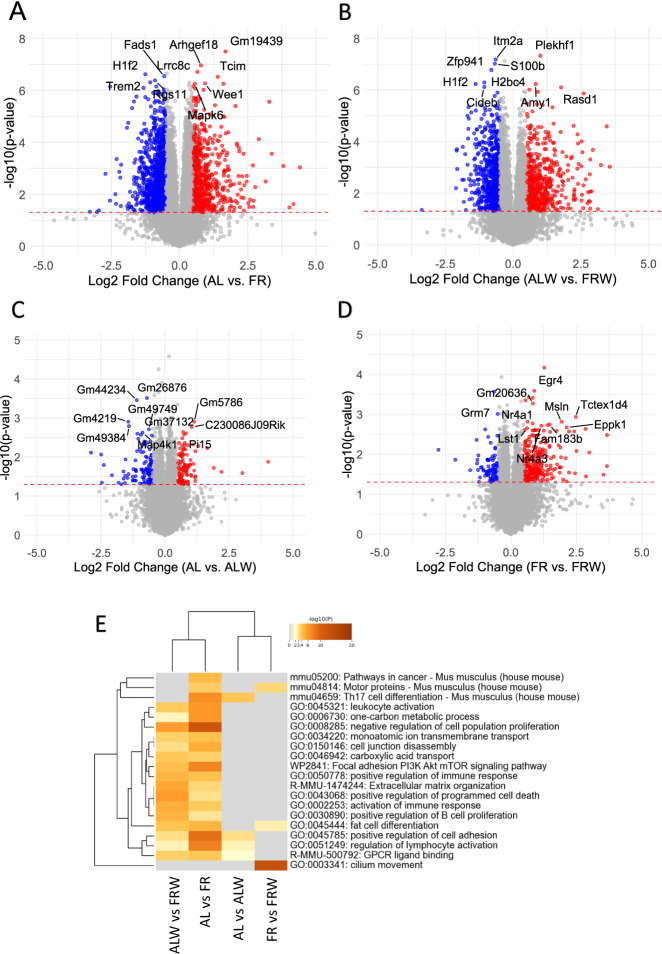
Anorexia nervosa (AN) is a complex psychiatric disorder characterized by severe caloric restriction and distorted body image, leading to significant psychological and physiological complications. Brain-derived neurotrophic factor (BDNF) plays a critical role in cognitive function and metabolic regulation. A mutation in the BDNF gene is associated with anorexia nervosa. This study examines the effects of food restriction, refeeding and short-term refeeding on the expression of Bdnf and its receptor (tropomyosin receptor kinase B TrkB/Ntrk2) in key brain regions involved in reward and cognitive function. We assessed BDNF mRNA levels in the dorsal striatum (DS), nucleus accumbens, ventral tegmental area, and prefrontal cortex (PFC) of AN-like mice subjected to different feeding regimes combined with or without physical activity. Cognitive flexibility was assessed using the Y-maze test. Whole RNA sequencing was also performed to analyse gene expression changes. Food restriction induced a transient decrease in cognitive flexibility and significantly decreased Bdnf expression in the DS and PFC. Progressive refeeding restored Bdnf in the DS but not the PFC. Short refeeding restored Bdnf levels to baseline. TrkB expression is increased by restriction only in the PFC. The presence of a running wheel cancelled these effects, suggesting an interaction between physical activity and diet. Pathway analysis of dysregulated genes revealed enrichment in immune regulation and cell-cell communication pathways. These findings highlight the complex relationship between diet, exercise, and brain function in AN-like mouse model and suggest avenues for further research into the clinical relevance of BDNF and TrkB as biomarkers of eating disorders.


Conflict of interest statement

Competing interests: PG received during the last 5 years fees for presentations at congresses or participation in scientific boards from Biogen, Janssen, Lundbeck, Merk, Otsuka, Richter and Viatris. The remaining authors declare no competing interests.

Figures

Fig. 1
Fig. 1. Effects of chronic food restriction and refeeding protocols on body weight, physical activity, cognitive flexibility and plasma BDNF levels.
AC Different feeding protocols (chronic food restriction, progressive refeeding and 24 h short refeeding) with the evolution of the body weight and physical activity (for ALW and FRW mice). D Y-maze reversal learning test showing the ratio of correct arm choice across learning and reversal phases in ad libitum with wheel (ALW) and food restriction with wheel (FRW) groups. E Delta correct ratio between the ad libitum learning and reversal phases. F Delta correct ratio between the first and last blocks of the reversal phase. GI Description of the reversal learning test with the delta of (H) the performance obtained between the last trial of the learning phase and the first trial of the reversal phase and (I) the performance obtained in the first trial of the reversal phase with the last trial. The orange dot corresponds to a piece of Miel Pop cereal (Kellogg’s) as a reward. J Plasma BDNF protein levels measured by ELISA across dietary protocols. Group names are as follows: ad libitum (AL, black), ad libitum with wheel (ALW, black), food restriction (FR, red), food restriction with wheel (FRW, red), progressive refeeding (FRpr, green), progressive refeeding with wheel (FRWpr, green), short refeeding (FRsr, yellow), and short refeeding with wheel (FRWsr, yellow). Data are presented as mean ± SEM for each experimental group. Significant differences are indicated as *p < 0.05, **p < 0.01, ****p < 0.0001. Statistical significance was determined using multiple t-test, unpaired t-test and one-way ANOVA followed by post-hoc Tukey’s test.
Fig. 2
Fig. 2. Effects of chronic food restriction, progressive refeeding, and short refeeding on Bdnf, TrkB and Nat8l expression in the dorsal striatum and prefrontal cortex. Correlation between gene expression and metabolic parameters.
mRNA expression levels of (A) Bdnf, (B) TrkB and (C) Nat8l in the dorsal striatum under different feeding protocols. DG Correlation heatmaps showing the relationship between gene expression and body weight (BW), glycemia (before feeding time) and circulating BDNF levels in different experimental groups. D ad libitum (AL + ALW), (E) Food restriction (FR + FRW), (F) Refeeding (FRpr + FRWpr), and (G) short refeeding (FRsr + FRWsr). The intensity of the color of the circles represents the strength of the correlation, with red indicating a positive correlation and blue indicating a negative correlation. The numbers represent correlation coefficients (r), and the size of the circles corresponds to the significance of the correlation (the larger the circle, the smaller the p-value). Group names are as follows: ad libitum (AL, black line), ad libitum with wheel (ALW, black filled), food restriction (FR, red line), food restriction with wheel (FRW, red filled), progressive refeeding (FRpr, green line), progressive refeeding with wheel (FRWpr, green filled), short refeeding (FRsr, yellow line), and short refeeding with wheel (FRWsr, yellow filled). Data are expressed as mean ± SEM. Significant differences are indicaed as *p < 0.05. Statistical significance was determined by one-way ANOVA with post-hoc Tukey’s test.
Fig. 3
Fig. 3. Effects of chronic food restriction, progressive refeeding, and short refeeding on Bdnf, TrkB and Nat8l expression in the prefrontal cortex. Correlation between gene expression and metabolic parameters.
mRNA expression levels of (A) Bdnf, (B) TrkB and (C) Nat8l in the prefrontal cortex under different feeding protocols. DG Correlation heatmaps showing the relationship between gene expression and body weight (BW), glycemia (before feeding time) and circulating BDNF levels in different experimental groups. D ad libitum (AL + ALW), (E) Food restriction (FR + FRW), (F) Refeeding (FRpr + FRWpr), and (G) short refeeding (FRsr + FRWsr). The intensity of the color of the circles represents the strength of the correlation, with red indicating a positive correlation and blue indicating a negative correlation. The numbers represent correlation coefficients (r), and the size of the circles corresponds to the significance of the correlation (the larger the circle, the smaller the p-value). Group names are as follows: ad libitum (AL, black line), ad libitum with wheel (ALW, black filled), food restriction (FR, red line), food restriction with wheel (FRW, red filled), progressive refeeding (FRpr, green line), progressive refeeding with wheel (FRWpr, green filled), short refeeding (FRsr, yellow line), and short refeeding with wheel (FRWsr, yellow filled). Data are expressed as mean ± SEM. Significant differences are indicated as *p < 0.05, **p < 0.01, ***p < 0.001. Statistical significance was determined by one-way ANOVA with post-hoc Tukey’s test.
Fig. 4
Fig. 4. RNA sequencing analysis reveals differentially expressed genes in the dorsal striatum across feeding and physical activity conditions.
AD Volcano plots show gene expression changes between different comparison groups: ad libitum (AL) vs food restriction (FR) (A), ad libitum with wheel (ALW) vs food restriction with wheel (FRW) (B), ad libitum (AL) vs ad libitum with wheel (ALW) (C), and food restriction (FR) vs food restriction with wheel (FRW) (D). Significantly downregulated genes (p < 0.05, log2FC < −0.5) are highlighted in blue, and significantly upregulated genes (p < 0.05, log2FC > 0.5) are in red. E Gene Ontology (GO) analysis of enriched pathways using Metascape. The heatmap represents the most significantly enriched biological processes across experimental conditions, including pathways related to cancer, cell proliferation, MAPK signalling, PI3K-Akt signalling, and immune regulation. Statistical significance was determined using Student’s t-test.

References

    1. Micali N, Hagberg KW, Petersen I, Treasure JL. The incidence of eating disorders in the UK in 2000-2009: findings from the general practice research database. BMJ Open. 2013;3:e002646. - PMC - PubMed
    1. Mainz V, Schulte-Rüther M, Fink GR, Herpertz-Dahlmann B, Konrad K. Structural brain abnormalities in adolescent anorexia nervosa before and after weight recovery and associated hormonal changes. Psychosom Med. 2012;74:574–82. - PubMed
    1. Rosen E, Bakshi N, Watters A, Rosen HR, Mehler PS. Hepatic complications of anorexia nervosa. Dig Dis Sci. 2017;62:2977–81. - PubMed
    1. Watson HJ, Yilmaz Z, Thornton LM, Hübel C, Coleman JR, Gaspar HA, et al. Genome-wide association study identifies eight risk loci and implicates metabo-psychiatric origins for anorexia nervosa. Nat Genet. 2019;51:1207–14. - PMC - PubMed
    1. Duriez P, Ramoz N, Gorwood P, Viltart O, Tolle V. A metabolic perspective on reward abnormalities in anorexia nervosa. Trends Endocrinol Metab. 2019;30:915–28. - PubMed

LinkOut - more resources