. 2025 Nov;4(11):1573-1588.
doi: 10.1038/s44161-025-00737-8. Epub 2025 Oct 17.

PRDM16 regulates smooth muscle cell identity and atherosclerotic plaque composition

Affiliations

PRDM16 regulates smooth muscle cell identity and atherosclerotic plaque composition

Josephine M E Tan et al. Nat Cardiovasc Res. 2025 Nov.

Abstract

Vascular smooth muscle cells (SMCs) undergo phenotype switching to acquire various fates in response to pathological stimuli. Among these, 'synthetic' SMCs-defined by migration, proliferation and extracellular matrix production-accumulate in atherosclerotic lesions and contribute to fibrous cap formation. The mechanisms driving this synthetic transition remain unclear. Here we identify PRDM16, a gene linked to cardiovascular disease, as a critical transcriptional repressor of the synthetic SMC phenotype. PRDM16 expression declined during SMC modulation, and its deletion in mice induced a synthetic program across all SMC subtypes even without pathological stimuli. Under atherogenic conditions, PRDM16 deficiency resulted in the formation of fibroproliferative plaques with more synthetic SMCs and fewer foam cells. Conversely, enforced PRDM16 expression suppressed SMC migration, proliferation and fibrosis. Mechanistically, PRDM16 occupied chromatin and suppressed activating marks at synthetic loci. These findings establish PRDM16 as a gatekeeper of SMC fate and reveal its role in shaping atherosclerotic plaque composition.


Conflict of interest statement

Competing interests: The authors declare no competing interests.

Figures
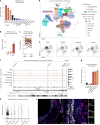
Fig. 1
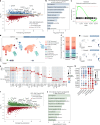
Fig. 1. PRDM16 expression decreases during SMC modulation in mouse and human atherosclerosis.
a, PRDM16 expression in human tissues from the GTEx database in transcripts per million (TPM) (dbGaP accession phs000424.v8.p2). Coro, coronary; Stom, stomach; LV, left ventricular; Vis, visceral; Sk. Musc.; skeletal muscle. b, PRDM16 mRNA levels in vascular cells in number of transcripts per million (nTPM), n = 3 (Human Protein Atlas). Values represent mean ± s.e.m. c, Expression of PRDM16 in endarterectomy samples of paired early- and late-stage lesions from the same human patients, n = 38. A paired t-test was performed, and the adjusted P value (P adj.) is shown after false discovery rate correction for multiple testing. d, UMAP visualization of clusters identified by scRNA-seq of human endarterectomy samples, n = 21. NK, natural killer; pDC, plasmacytoid dendritic cell; cDC, conventional dendritic cell. e, UMAP feature plots showing expression of PRDM16, MYH11 and modulated SMC marker genes LUMICAN and VCAM1. f, Visualization of snATACseq tracks at the PRDM16 locus from human coronary artery samples (N = 41 patients), clustered by cell type and showing the locations of SNPs associated with CVD and/or stroke. m.b., megabase. g, Prdm16 mRNA levels in mouse BAT, inguinal WAT (iWAT), PVAT, aortic arch, descending aorta and abdominal aorta. Values represent mean ± s.e.m, n = 3 mice. h, Violin plot showing Prdm16 mRNA levels (TPM) in cell clusters from mouse aortas. i, Immunostaining for PRDM16 (green), MYH11 (white), Lumican (magenta) and DAPI (nuclei, blue) in sagittal section of aorta containing a lesion from mice treated with AAV8-PCSK9-D377Y and western diet for 12 weeks. Scale bar, 50 µm. M, tunica media, L, lumen. Representative of n = 6 mice. Source data
Fig. 2
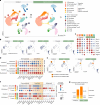
Fig. 2. PRDM16 represses the synthetic gene program in SMCs under homeostatic conditions.
a, Expression MA plot of differentially expressed genes between control and cKO aortae (n = 5 per group). Blue: genes upregulated in cKO (log2FC > 0.5 and P adj. <0.1). Red: genes downregulated in cKO (log2FC <−0.5 and P adj. <0.1). Gray: unchanged genes. b, GO analysis of genes upregulated cKO versus control aortae. c, Gene set enrichment analysis showing enrichment of hallmark process ‘epithelial to mesenchymal transition’ in cKO versus control aortae. d, UMAP visualization of scRNA-seq expression data from control (n = 4, 11,297 cells) and cKO aortae (n = 4, 9,118 cells). e, Dot plot showing the expression of cluster-defining genes. f, Bar charts showing the proportion of cells assigned to each cluster. g, UMAP feature plot of Ankrd1 and Col14a1 expression in clusters from d. h, Dot plot displaying synthetic gene levels in SMC clusters from control and cKO aortae. i, Expression MA plot of differentially expressed genes between control and iKO aortae (n = 3 per group). Green: genes upregulated in iKO (log2FC > 0.5 and P adj. <0.1). Red: genes downregulated in iKO (log2FC < −0.5 and P adj. <0.1). Gray: unchanged genes. j, GO analyses of genes upregulated in iKO versus control aortae. Source data
Fig. 3
Fig. 3. Loss of PRDM16 drives synthetic SMC modulation and fibrosis during atherogenesis.
a, Lesion area in aortae from control and cKO mice injected with AAV8-mPCSK9 D377Y followed by Western diet feeding for 12 weeks (averaged from 5 sequential sagittal sections spaced 24 µm apart). Values represent mean ± s.d., n = 14/12 control/KO. b, H&E-stained sagittal sections of aortic arch showing lesions in control and cKO mice. Representative of n = 14/12 control/cKO, Scale bar, 100 µm. Schematic of aortic arch: I, brachiocephalic artery; III, left subclavian artery; Ds, descending aorta. c, Sirius red/Fast-Green staining for collagen in aortic arch sections from control and cKO mice. Scale bar, 50 µm. d, Sirius-red-positive area per lesion area. Values represent mean ± s.e.m. Each dot represents a lesion, n = 19/18 control/cKO from n = 5/5 control/cKO mice. An unpaired, two-tailed t-test was performed, P < 0.0001 with an F-test for variance (n.s.). e, Immunostaining for PLIN2 (green), ACTA2 (SMA, magenta) and DAPI (nuclei, blue) in lesions from control and cKO mice. Scale bar, 50 µm. f, PLIN2 positive area per lesion area (n = 5/6 lesions of control and cKO mice. Values represent mean ± s.e.m. Each dot represents a lesion from three mice per group. An unpaired, two-tailed t-test was performed, P < 0.0001, with an F-test for variance (n.s.). g, Ki67 and ACTA2 double-positive cells per lesion area. Values represent mean ± s.e.m. Each dot represents a lesion, n = 17/13 for control/cKO mice. An unpaired, two-tailed t-test was performed, P < 0.0001, with an F-test for variance (n.s.). Prol’n, proliferation. h, Sirius red/Fast-Green staining for collagen in aortic arch of control and cKO mice injected with AAV8-mPCSK9 D377Y and maintained on Western diet (WD) for 18 weeks. Scale bar, 50 µm. i, Sirius-red-positive area per lesion area. Data are represented as mean ± s.e.m. Each dot represents a lesion, n = 45/34 lesions from n = 7/5 mice for control/KO. An unpaired, two-tailed t-test was performed with an F-test for variance (n.s.). j, Individual lesion size. Values represent mean ± s.d. Each dot represents a lesion, n = 45/33 lesions from n = 5/7 control/cKO mice. An unpaired, two-tailed t-test with Welch’s correction was performed with an F-test for variance (P = 0.01). M, tunica media; L, lumen; n.s., not significant. Source data
Fig. 4
Fig. 4. Acute loss of PRDM16 promotes synthetic SMC modulation and fibrosis.
a, H&E staining of sagittal sections of aortic arch from control and SMC-iKO mice at 12 weeks of HFD feeding (lesion area outlined in green). Lesions in the arch, the start of the descending aorta and the beginnings of the branches were included. Scale bar, 100 µm. b, Lesion area (averaged from five sequential sagittal sections 24 µm apart per aorta). Values represent mean ± s.d., n = 13/11 from control/iKO mice. c, Sirius red/Fast-Green staining for collagen in aortic arches from control and iKO mice. Scale bar, 50 µm. d, Sirius-red-positive area per lesion area. Values represent mean ± s.e.m. Each dot represents a lesion, n = 13/15 lesions from n = 5/5 control/iKO mice. An unpaired, two-tailed t-test was performed with Welch’s correction, P = 0.0019 with an F-test for variance (P = 0.0002). e, PLIN2-positive area per lesion area in control and iKO mice. Values represent mean ± s.e.m. Each dot represents a lesion, n = 9/6 lesions from n = 3/3 control/iKO mice. An unpaired, two-tailed t-test was performed, P < 0.0001 with an F-test for variance (n.s.). f, Immunostaining for PLIN2 (green), ACTA2 (SMA, magenta) and DAPI (nuclei, blue) in lesions from control and iKO mice. Representative of n = 3 per group. Scale bar, 50 µm. M, tunica media, L, lumen. Source data
Fig. 5
Fig. 5. Loss of PRDM16 drives synthetic gene expression in all SMC populations and increases synthetic SMC content during atherosclerosis.
a, UMAP visualization of scRNA-seq expression data from aortae of control (n = 4 (pooled), 9,653 cells) and SMC-iKO mice (n = 4 (pooled), 12,254 cells) injected with AAV8-Pcsk9-D377Y and fed a Western diet for 18 weeks. b, UMAP feature plots of Cnn1, Prdm16 exon 9 and Ankrd1 expression. c, Dot plot showing expression of: SMC contractile genes (cluster 1), Vmp1 (marker of premodulated SMCs, cluster 2), Col6a3 (marker of synthetic modulated SMCs, cluster 4) and Pdgfra (fibroblast marker, cluster 9). d, Dot plot showing expression of pre- and synthetic-modulation genes in the three Myom1 + SMC clusters (quiescent, premodulated and synthetic modulated) from control and iKO aortae. e, UMAP feature plots showing expression of Tnfrsf11b (marker of pre- and synthetic modulation) and Vcam1 (marker of advanced modulation), in control and iKO aortae. S, synthetic modulated SMCs; A, advanced modulated SMCs. f, Dot plot showing expression of (pre, synthetic and advanced) SMC modulation genes in the three Sod3 + SMC clusters (activated, advanced and foamy) from control and iKO aortae. g, Bar chart showing the proportion of modulated SMC clusters as a percentage of the total SMC cells.
Fig. 6
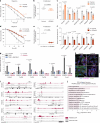
Fig. 6. PRDM16 expression represses SMC synthetic processes and fibrosis.
a, Migration of hCaSMCs expressing either a control CRISPRa or a CRISPRa guide to activate PRDM16. Scratch closure was quantified by microscopy every 2 h. Values represent mean ± s.e.m., n = 6 biological replicates per group. Regression slopes were significantly different between groups (F(1,59) = 15.39, P = 0.0002). b, MTT assay for cell proliferation in cells from a. Values represent mean ± s.e.m., n = 11 biological replicates per group. An unpaired, two-tailed t-test was performed, P = 0.0012 with an F-test for variance (n.s.). c, mRNA levels of indicated genes in control and PRDM16-CRISPRa cells. Values represent mean ± s.e.m., n > 5 biological replicates per group. Multiple paired t-tests were performed with Holm–Šídák correction for multiple testing. d, Quantification of migration of hCaSMCs transduced with control or PRDM16-expressing lentivirus. Scratch closure was quantified every 2 h. Values represent mean ± s.e.m., n = 5 biological replicates per group. Regression slopes were significantly different between groups (F(1,86) = 38.88, P < 0.0001. e, MTT assay for cell proliferation in control and lentiviral (LV) PRDM16-expressing cells. Values represent mean ± s.e.m., n = 7/8 biological replicates for control/PRDM16. An unpaired, two-tailed t-test was performed, P < 0.0001, with an F-test for variance (n.s.). f, mRNA levels of indicated genes in control and LV-PRDM16-expressing hCaSMCs. Values represent mean ± s.e.m., n > 4 biological replicates. Multiple paired t-tests were performed with Holm–Šídák correction for multiple testing. g, mRNA levels of indicated genes in control and PRDM16-expressing fibroblasts treated with TGFβ1 and/or SB431542 or vehicle control for 48 h. Values represent mean ± s.e.m., n ≥ 3 biological replicates per condition. One-way ANOVA with Holm–Šídák correction. Normality confirmed by Kolmogorov–Smirnov test. h, Immunostaining for phalloidin (magenta), ACTA2 (SMA, green) and DAPI (nuclei, blue) in control and PRDM16-expressing cells treated with or without TGFβ1 for 48 h (representative of n = 3 biological replicates). Scale bar, 10 µm. i, ChIP-seq tracks for PRDM16 and H3K27-Ac at indicated synthetic genes in control and PRDM16-expressing fibroblasts. j, GO analysis of genes with PRDM16 ChIP-seq peaks that also display a concomitant decrease of H3K27-Ac in PRDM16-expressing versus control cells. Source data
Extended Data Fig. 1
Extended Data Fig. 1. PRDM16 is expressed in SMCs and downregulated during atherosclerosis.
a. tSNE showing cell clusters from scRNAseq of human carotid artery plaques, n=9. b. SMC clusters from (b). c. Dot plot showing PRDM16 expression in all clusters from (b). d. UMAP of gene expression in 6,753 cells from adult thoracic aortae of 13-week-old male CD1 mice29. e. UMAP feature plot of Prdm16 expression in clusters from (e). f. Immunostaining for PRDM16 (green), MYH11 (white), Lumican (magenta) and DAPI (nuclei, blue) in a sagittal section of an aortic lesion from Apoe-/- mice fed a western diet for 18 weeks. Scale bar: 50 µm. Representative of n=3 mice.
Extended Data Fig. 2
Extended Data Fig. 2. Loss of Prdm16 in SMCs leads to upregulation of the synthetic gene program.
a. Immunostaining for PRDM16 (green), MYH11 (magenta), PECAM1 (CD31, white), and DAPI (nuclei, blue) in descending aorta from control and cKO mice. Scale bar: 20 µm. b. Bodyweights of 8-week-old male control (n=14) and cKO (n=16) mice. Values represent mean ± S.D. c. Oral glucose tolerance test in mice from (b). Values represent mean ± S.E.M. (n=7 per group). d. H&E staining of descending aorta from control and cKO mice. Scale bar: 100 µm. e. Media thickness of descending aorta in control and cKO mice (average of 6 equally spaced-out measurements per aorta). Values represent mean ± S.D. (n=3 mice per group). An unpaired, two-tailed t-test was performed, with an F-test to compare variances (ns). f. Van Gieson stain for Elastin. Scale bar: 100 µm. g. Blood pressure (BP) in 10-week-old control (n=9) and cKO (n=7) mice (each dot = average BP from 5 days consecutive measurements). Data are represented as mean ± S.D. An unpaired, two-tailed t-test was performed. F-test for variance (ns) h. Heatmap of the top regulated genes in control vs. cKO aortae (n=5 per group). (bottom right) GO analyses of genes downregulated in cKO vs. control aortae. i. Expression MA plot (Fig. 2a), with unchanged SMC phenotypic transition genes annotated. j. UMAP visualization of indicated genes in control and cKO aortae.
Extended Data Fig. 3
Extended Data Fig. 3. Acute loss of Prdm16 in SMCs of adult mice leads to upregulation of the synthetic gene program.
a. Immunostaining for MYH11 (magenta), PRDM16 (green), PECAM-1 (CD31, white), and DAPI (nuclei, blue) in descending aorta from control and iKO mice. Scale bar: 20 µm. b. Blood pressure in 10-week-old control (n=8) and iKO (n=7) mice. Values represent mean ± S.E.M. Each dot corresponds to average blood pressure of 4 days consecutive measurements. An unpaired, two-tailed t-test was performed, with F-test for variance (ns). c. Media thickness of descending aorta in control and iKO mice. Values represent mean ± S.D, and represent average of 6 equally spaced-out measurements per aorta (n=3 mice per group). An unpaired, two-tailed t-test was performed, with an F-test for variance (ns). d. H&E staining of descending aortae from control and iKO mice. Scale bar: 200 µm. e. Van Gieson stain for Elastin in control and iKO aortae. Scale bar: 200 µm. Representative of n=3 mice. f. Heatmap of top regulated genes in control vs. iKO aortae (n=5 per group). Bottom right: GO analysis of genes downregulated in iKO vs control aortae. g. Expression MA plot from Fig. 2i, with unchanged SMC phenotypic transition genes annotated. (A: tunica adventitia, M: tunica media, L: lumen). Source Data
Extended Data Fig. 4
Extended Data Fig. 4. Loss of SMC-PRDM16 drives synthetic SMC modulation and fibrosis during atherogenesis.
a. Body weights of control and cKO mice from the time of AAV8-Pcsk9-D377Y injection (8-weeks-old) and throughout 12 weeks of western diet feeding. Values represent mean ± S.E.M., n = 15/16 control/KO. b–e. FPLC measurements of total cholesterol (b) high-density lipoprotein (HDL) (c), non-high density lipoprotein fraction (non-HDL) (d) and triglyceride (e) in plasma samples from mice in (a). Values represent mean ± S.E.M, n = 15/16 control/KO. Multiple paired t-tests (1 per timepoint) were performed with Holm-Šídák correction for multiple testing. f. H&E-stained sections of aortae showing atherosclerotic lesions in control and cKO mice (lesion area outlined in blue). Scale bar: 100 µm. g. H&E staining of sequential sections through the same lesion from a cKO mice, Scale bar: 100 µm. h. Immunostaining for Ki67 (Cyan), ACTA2 (SMA, magenta), and DAPI (nuclei, blue) in lesions from control and cKO mice. Representative of n=3 per group. Scale bar: 50 µm. i. H&E staining of sagittal sections from the aortic arch of control and cKO mice at 18 weeks of Western diet feeding (lesion area outlined in blue). Scale bar: 100 µm. j. Body weights of control and cKO mice throughout 18 weeks of Western diet feeding. k. Total lesion area of control (n=7) and cKO (n=5) mice. M: tunica media, L: lumen. Source Data
Extended Data Fig. 5
Extended Data Fig. 5. Inducible loss of Prdm16 promotes the development of fibrous plaques.
a. Body weights of control and iKO mice from the time of PCSK9 injection (8-weeks-old) and throughout 12 weeks of western diet feeding. Values represent mean ± S.E.M. (n = 15/13 control/KO). Multiple paired t-tests with Welch correction were performed with Holm-Šídák correction for multiple testing. b. H&E-stained sagittal sections of the aortic arch from control and iKO mice. Images are representative of n=13/11 control/KO. Scale bar: 50 µm. A diagram of the aortic arch shows the orientation: I= brachiocephalic artery, III = left subclavian artery, Ds = descending aorta. Source Data
Extended Data Fig. 6
Extended Data Fig. 6. Atherosclerosis induces the development of multiple types of modulated SMCs.
a. UMAP visualization of scRNAseq expression data from control aortae under homeostatic (11,297 cells, n=4 pooled) and atherogenic conditions (9,653 cells, n=4 pooled) (AAV8-PCSK9-D377Y injection and Western diet for 18 weeks). b. Bar charts representing the proportion of cells assigned to each cluster relative to the total number of cells. c. UMAP feature plots showing expression of immune and foam cell marker genes. d. Dot plot displaying the expression of cluster-defining genes. Blue boxes used to annotate the foamy modulated SMC- and the Macrophage Trem2 clusters. e. Bar charts representing the proportion of SMC types relative to the total number of SMCs. Source Data
Extended Data Fig. 7
Extended Data Fig. 7. Loss of PRDM16 drives synthetic gene expression in all SMC populations and increases synthetic SMC content during atherosclerosis.
a. Body weights of control and SMC-iKO mice injected with AAV8-PCSK9-D377Y and fed a Western diet for 18 weeks (n=4 per group). b. Bar charts representing the proportion of cells assigned to each cluster relative to the total number of cells. c. Dot plot showing the expression of SMC-cluster marker genes identified under atherogenic conditions. Red box indicates tdTomato+ (SMC-lineage+) cells. d. Dot plot showing expression of synthetic and circulatory development genes affected by PRDM16 in baseline SMC clusters from control and SMC-iKO aortae. e. Bar charts representing the proportion of the different SMC clusters relative to the total number of SMCs. f. Absolute number of cells in each (modulated) SMC cluster shown in e.
Extended Data Fig. 8
Extended Data Fig. 8. PRDM16 expression represses SMC synthetic processes and fibrosis.
a. Ct values for PRDM16/Prdm16 mRNA levels in mouse aorta, hCaSMCs, and hCaSMCs transduced with PRDM16-CRISPRa or PRDM16 lentivirus (LV). b. Immunoblot showing PRDM16 protein levels in control and PRDM16-CRISPRa hCaSMCs. Cofilin was used as a loading control (n=3 per condition). c. mRNA levels of indicated genes in control and PRDM16-CRISPRa hCaSMCs. d. Images of the scratch-migration assay from Fig. 6a. The yellow lines mark the wound borders. e. Images from the scratch assay in Fig. 6d. The yellow lines mark the wound borders. f. immunoblot showing PRDM16 protein levels in control and LV-PRDM16 expressing hCaSMCs. Representative of n=3. Cofilin was used as a loading control. g. Ct values for Prdm16 mRNA in mouse aorta, mouse fibroblasts and fibroblasts expressing PRDM16. h. mRNA levels of indicated genes in control and PRDM16-expressing fibroblasts. Values represent mean ± S.E.M. (n = 3 biol. repl.). i. Immunoblot for PRDM16, SMAD3 and phospho-SMAD3 (pSMAD3) in PRDM16-expressing and control cells ± TGFb and/or SB431542. β-actin was used as a loading control. Image is representative of n = 3. j. ChIP tracks for PRDM16 and H3K27-Ac in aortae from C57B6/J mice. k. GO analysis of genes with a PRDM16 ChIP-seq peak. l. Intersection of GO analysis with ChIP-seq tracks: each gene entry corresponds to an identified ChIP-seq peak and associated GO terms.

References

    1. Libby, P. et al. Atherosclerosis. Nat Rev Dis Primers5, 56 (2019). - PubMed
    1. Lusis, A. J. Atherosclerosis. Nature407, 233–241 (2000). - PMC - PubMed
    1. Libby, P., Ridker, P. M. & Hansson, G. K. Progress and challenges in translating the biology of atherosclerosis. Nature473, 317–325 (2011). - PubMed
    1. Rader, D. J. & Daugherty, A. Translating molecular discoveries into new therapies for atherosclerosis. Nature451, 904–913 (2008). - PubMed
    1. Gomez, D. & Owens, G. K. Smooth muscle cell phenotypic switching in atherosclerosis. Cardiovasc. Res.95, 156–164 (2012). - PMC - PubMed

MeSH terms

LinkOut - more resources