

Integrated multi-omics identifies plant hormone signal transduction and phenylpropanoid biosynthesis as key pathways in kiwifruit (Actinidia chinensis var. deliciosa) resistance to Botryosphaeria Dothidea infection
- PMID: 41107730
- PMCID: PMC12532962
- DOI: 10.1186/s12870-025-07480-z
Integrated multi-omics identifies plant hormone signal transduction and phenylpropanoid biosynthesis as key pathways in kiwifruit (Actinidia chinensis var. deliciosa) resistance to Botryosphaeria Dothidea infection
Abstract
Background: Soft rot, a devastating fungal disease, severely impacts kiwifruit during postharvest storage, causing substantial fruit damage and rendering the fruit inedible. Botryosphaeria dothidea (B. dothidea) is the primary pathogen causing kiwifruit soft rot, but its pathogenic mechanism remains unclear.
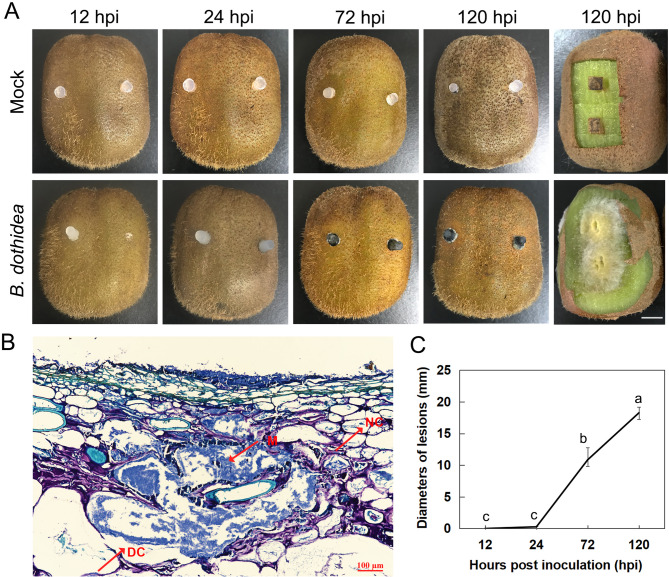
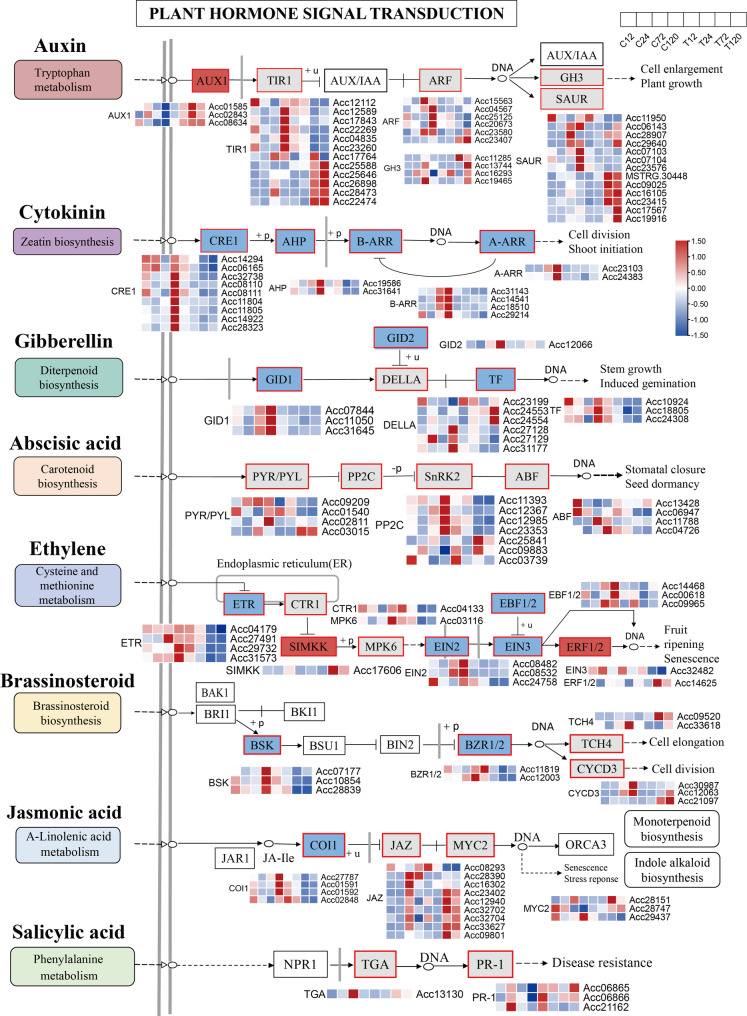
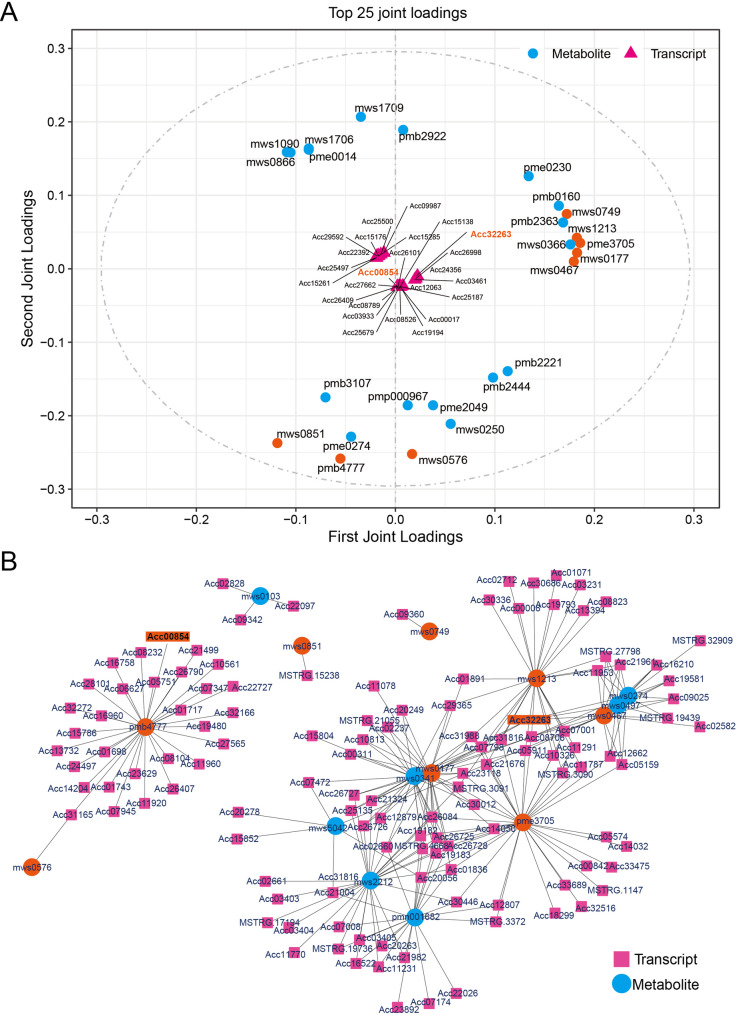
Results: In this study, morphological observation, transcriptome sequencing, and untargeted metabolomics were employed to analyze the changes in 'Jinkui' kiwifruit after artificial inoculation with B. dothidea. The results showed that obvious lesions began to appear on the fruit surface at 72 h post-inoculation (hpi) with B. dothidea, and the peel rot initiated at 120 hpi. Transcriptome sequencing revealed a significantly higher number of differentially expressed genes (DEGs) at 72 and 120 hpi than at 12 and 24 hpi. KEGG enrichment analysis indicated that DEGs at 72 and 120 hpi were significantly enriched in the plant hormone signal transduction pathway. A total of 403 metabolites were identified via untargeted metabolomics, among which the number of differentially accumulated metabolites (DAMs) was highest at 72 hpi (46 DAMs). These DAMs predominantly belong to the lipid and organic acid classes and are associated with pathways such as phenylpropanoid biosynthesis and secondary metabolite biosynthesis. Co-enrichment analysis revealed significant enrichment of DEGs and DAMs in the phenylpropanoid biosynthesis pathway. The correlation between DEGs and DAMs was assessed using the O2PLS model and the Pearson correlation coefficient. Two key DEGs were identified: a MYB transcription factor (Acc32263) and a ChlH-like gene (Acc00854), both of which potentially play crucial regulatory roles in the pathogenesis of kiwifruit soft rot.
Conclusions: Significant changes in kiwifruit tissue morphology, gene expression, and metabolite profiles were observed after 72 h of B. dothidea infection. The plant hormone signal transduction and phenylpropanoid biosynthesis pathways are closely associated with the pathogenesis of kiwifruit soft rot. The MYB transcription factor (Acc32263) and the ChlH-like gene (Acc00854) are likely to be the key regulators. This study identifies the core regulatory pathways and genes involved in kiwifruit soft rot, provides new insights into the pathogenic mechanism of B. dothidea, and offers theoretical support for developing effective strategies to control kiwifruit soft rot.
Keywords: B. dothidea; Kiwifruit; Metabolome; Soft rot; Transcriptome.
© 2025. The Author(s).
Conflict of interest statement
Declarations. Ethics approval and consent to participate: Not applicable. Consent for publication: Not applicable. Competing interests: The authors declare no competing interests.
Figures


References
-
- Zhang C, Li W, Long Y, Su Y, Zhang Q. Co-application of tetramycin and matrine improves resistance of Kiwifruit against soft rot and enhances its quality and amino acids. Antibiot Basel Switz. 2022;11:671.
-
- Li K, Zhang C, Wang W, Chen C, Liu Q, Yin H. First report of neopestalotiopsis clavispora causing postharvest fruit rot on actinidia Arguta in Liaoning province, China. Plant Dis. 2023;107:217. - DOI
-
- Li L, Pan H, Chen MY, Zhong CH. First report of Pestalotiopsis microspora causing postharvest rot of Kiwifruit in Hubei province, China. Plant Dis. 2016;100:2161. - DOI
MeSH terms
Substances
Grants and funding
- 32302519/National Natural Science Foundation of China
- 31701872/National Natural Science Foundation of China
- 2025NKYJJ27/Youth Foundation of Hubei Academy of Agricultural Sciences
- CARS-26-62/Earmarked Fund for CARS
- 2025-620-000-001-019/Hubei Provincial Agricultural Science and Technology Innovation Fund
LinkOut - more resources
Full Text Sources
