. 2025 Oct 17;25(1):361.
doi: 10.1186/s12935-025-04012-5.

Novel combination therapy with phenformin enhances the effects of lenvatinib in hepatocellular carcinoma via AMPK-mediated PDGFRβ degradation

Affiliations

Novel combination therapy with phenformin enhances the effects of lenvatinib in hepatocellular carcinoma via AMPK-mediated PDGFRβ degradation

Duo Li et al. Cancer Cell Int. .

Abstract

Background: Hepatocellular carcinoma (HCC) is an invasive malignant tumour for which few effective treatment options are currently available. Lenvatinib is a small-molecule inhibitor of multiple receptor tyrosine kinases used for the treatment of patients with advanced HCC. Although lenvatinib has been proven effective in treating HCC patients, clinical data show that the response rate to lenvatinib is very low and that 76% of HCC patients are insensitive to lenvatinib. Phenformin is a well-known activator of adenosine monophosphate-activated protein kinase (AMPK), which has recently attracted widespread attention because of its anticancer effects. We investigated whether phenformin could enhance the efficacy of lenvatinib in treating HCC and, if so, the underlying mechanisms involved in this process.

Methods: The anticancer effects of the combination of phenformin and lenvatinib in HCC cells were assessed in vitro and in vivo. First, colony formation, EdU and MTT assays were conducted to measure the viability of the HCC cells. Flow cytometry was used to assess the cell cycle distribution of HCC cells. Then, western blotting (WB) was performed to detect protein expression in HCC cells after various treatments. Immunoprecipitation-mass spectrometry (IP-MS) and co-immunoprecipitation (Co-IP) assays were used to determine the interaction relationships of proteins. In addition, a xenograft model was used to analyze the effects of the different treatments on the proliferation of HCC cells. Immunohistochemistry and western blot assays were conducted to investigate the expression of related proteins in the tissues of the xenograft model. Haematoxylin and eosin (H&E) staining was used to analyze the toxicity to the livers and kidneys of mice. Western blot assays were used to detect protein expression in human HCC samples.

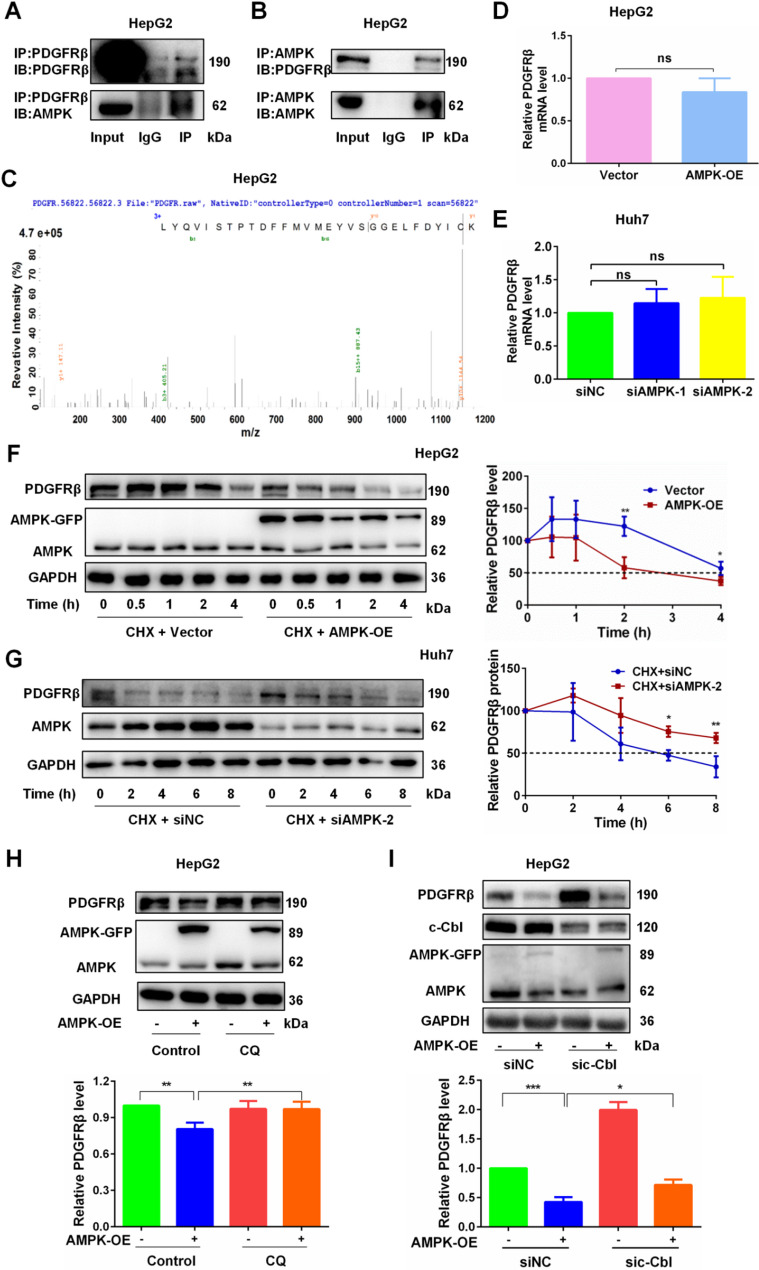
Results: High expression of platelet-derived growth factor receptor β (PDGFRβ) resulted in the insensitivity of HCC cells to lenvatinib, and PDGFRβ knockdown increased the sensitivity of HCC cells to lenvatinib. Phenformin inhibited the proliferation of HCC cells via AMPK-mediated PDGFRβ degradation. Compared with lenvatinib monotherapy, combined treatment with phenformin and lenvatinib considerably enhanced the anticancer effects both in vivo and in vitro. Mechanistic studies showed that AMPK binds PDGFRβ and promotes its degradation via the c-Cbl-mediated lysosomal pathway.

Conclusions: Our study reports a novel combined therapy using phenformin and lenvatinib, which can increase the sensitivity of HCC cells to lenvatinib via AMPK-mediated PDGFRβ degradation. Hence, this treatment strategy may provide a personalized approach for treating HCC patients with high PDGFRβ expression and facilitate the development of basic and clinical research on the use of lenvatinib for the treatment of HCC.

Keywords: AMPK; Hepatocellular carcinoma; Lenvatinib; PDGFRβ; Phenformin.


Conflict of interest statement

Declarations. Consent for publication: Not applicable. Competing interests: The authors declare no competing interests.

Figures

Fig. 1
Fig. 1
The high expression of PDGFRβ was closely related to the poor sensitivity of HCC cells to lenvatinib. A, WB was performed to detect the relative protein levels of PDGFRβ in paired HCC samples and representative bands were presented (left panel). The relative band densities from all of the detected 20 patients were analyzed by Image J software and normalized by GAPDH (right panel); B, The expression levels of PDGFRβ in different types of HCC cells was detected by WB; C, Viability of HCC cells treated with lenvatinib (0, 2, 4, 8, 16, 24 µM) for 72 h was detected by MTT assay; D, WB analysis of PDGFRβ in HCC cell lines treated with lenvatinib (0, 1, 4 µM) for 24 h. GAPDH served as a loading control. n = 3; E, Representative tumour images of each groups of HepG2 and Huh7 xenografts treated with lenvatinib with a indicated concentrations for 14 days at the end of treatment. Date are mean ± s.e.m. n = 5; F, Tumour weight of each group of HepG2 and Huh7 xenografts. n = 5; G, Growth curves of each group of HepG2 and Huh7 xenografts. n = 5; H, WB analysis of PDGFRβ in HepG2 and Huh7 xenografts. GAPDH served as a loading control, n = 3; I, siNC or siPDGFRβ cells were plated in 6-well plates (3.0 × 105/well) and lysed when density reached 80%–90%. The expression of PDGFRβ was detected by WB. n = 3; J, The inhibitory effects of lenvatinib on proliferation of siNC or siPDGFRβ HCC cells were compared by MTT assay. n = 3. GAPDH served as a loading control. Data are mean ± s.e.m. *P < 0.05; **P < 0.01; ***P < 0.001 vs. Control or model; ns, not significant
Fig. 2
Fig. 2
The effect of regulating AMPK on the level of PDGFRβ and HCC cell viability. A, WB analysis of total AMPK level in different types of HCC cell lines (Huh7, HepG2, and SK-HEP1). n = 3; B, WB analysis of AMPK levels in HepG2 cells infected with control vector or AMPK-OE vector. n = 3; C, AMPK was knockdown in Huh7 cells using two independent siRNAs. WB analysis was performed to analyze the level of AMPK. n = 3. GAPDH served as a control; D, The EdU analysis of DNA synthesis in HepG2 cells infected with control or AMPK-OE vector. n = 3; E, The EdU analysis of DNA synthesis in Huh7 cells infected with control or AMPK siRNA. n = 3; F, MTT assays were used to detect the cell viability of HepG2 cells infected with control or AMPK-OE vector. n = 3; G, The cell viability of AMPK-knockdown Huh7 cells was detected by MTT assay. n = 3; H, WB assay was used to detect the level of PDGFRβ in AMPK-OE HepG2 cells. n = 3; I, WB assay was used to detect the level of PDGFRβ in AMPK-knockdown Huh7 cells. n = 3. GAPDH served as a loading control. Date are mean ± s.e.m. *P < 0.05; **P < 0.01; ***P < 0.001; ns, not significant. Scale bar = 100 μm
Fig. 3
Fig. 3
The effect of regulating AMPK on the level of PDGFRβ and sensitivity of HCC cells to lenvatinib. A, Cell viability of AMPK-OE HepG2 cells treated with lenvatinib (0, 4, 8, 12, 16 µM) for 48 h was detected by MTT assay; B, Cell viability of AMPK knockdown Huh7 cell lines treated with lenvatinib (0, 0.5, 1, 2, 4 µM) for 48 h was detected by MTT assay; C, WB analysis of PDGFRβ in AMPK-OE HepG2 cells were cultured with lenvatinib (0, 4 µM) for 24 h. GAPDH served as a loading control; D, WB assay analysis of PDGFRβ in AMPK knockdown Huh7 cells cultured with lenvatinib (0, 4 µM) for 24 h. GAPDH served as a loading control; E, DNA synthesis of AMPK-OE HepG2 cells treated with lenvatinib (0, 4 µM) for 48 h was detected by EdU assay; F, DNA synthesis of AMPK knockdown Huh7 cells treated with lenvatinib (0, 4 µM) for 48 h was detected by MTT assay. Date are mean ± s.e.m. n = 3.*P < 0.05; **P < 0.01; ***P < 0.001; ns, not significant. Scale bar = 100 μm
Fig. 4
Fig. 4
AMPK binds to PDGFRβ and promotes its degradation via the c-Cbl -mediated lysosomal pathway. A–B, Co-IP experiment validated the interaction between endogenous AMPK and PDGFRβ in HepG2 cells. Total protein was extracted from HepG2 cells and immunoprecipitated with anti-PDGFRβ (A) or anti-AMPK antibodies (B). WB assay detected the relevant proteins in the immunoprecipitated complex. Input represents the expression of AMPK and PDGFRβ in the total protein; C, IP-MS experiment confirmed the interaction between AMPK and PDGFRβ; DE, qRT-PCR experiments were using to detect the mRNA level of PDGFRβ in AMPK-OE HepG2 cells (D) and AMPK knockdown Huh7 cells (E); FG, The effect of AMPK on the stability of PDGFRβ protein in HCC cells was tested by WB assay; F, AMPK-OE HepG2 cells were treated with 20 µg/mL CHX for the designated time (0, 0.5, 1, 2, 4 h); G, AMPK knockdown Huh7 cells were treated with 40 µg/mL CHX for the designated time (0, 2, 4, 6, 8 h). The left is a representative image, and the right is a half-life curve graph drawn based on the grayscale values of the bands. GAPDH served as a loading control; H, AMPK-OE HepG2 cells was pretreated with 2.5 µM CQ for 6 h. The level of PDGFRβ was detected by WB assay. GAPDH served as a loading control; I, sic-Cbl decreased the downregulation of PDGFRβ in AMPK-OE HepG2 cells. GAPDH served as a loading control. Date are mean ± s.e.m. n = 3.*P < 0.05; **P < 0.01; ***P < 0.001; ns, not significant
Fig. 5
Fig. 5
Phenformin promotes the degradation of PDGFRβ via the c-Cbl-mediated lysosomal pathway. A, The viability of HepG2 cells treated with phenformin (0, 600 µM) for 72 h was evaluated by MTT assay; B, The mRNA levels of PDGFRβ in HepG2 cells treated with phenformin for different time (0, 12, 24 h) was detected by qRT-PCR; C, WB assay detected the level of PDGFRβ in HepG2 cells treated with phenformin (0, 300, 600 µM) for 24 h; D, The effect of phenformin on the stability of PDGFRβ protein in HepG2 cells was tested by WB assay. HepG2 cells were pretreated with 20 µg/mL CHX for the designed time (0, 0.5, 1, 2, 4 h), then cells were incubated with phenformin (0, 600 µM) for 24 h. Finally, the level of PDGFRβ was detected by western blot assay. The left is a representative image, and the right is a half-life curve graph drawn based on the grayscale values of the bands; E, CQ reverses the stability of PDGFRβ protein in phenformin-treated HepG2 cells. HepG2 cells were pretreated with 2.5 µM CQ for 6 h, and then were incubated with 600 µM phenformin for 24 h, followed by the total protein of the cells was extracted. Finally, WB assays performed to detect the level of PDGFRβ. GAPDH served as a loading control; F, sic-Cbl weakened the downregulation of PDGFRβ caused by phenformin. GAPDH served as a loading control. Date are mean ± s.e.m. n = 3.*P < 0.05; **P < 0.01; ***P < 0.001; ns, not significant
Fig. 6
Fig. 6
Phenformin enhances the inhibitory effect of lenvatinib on HCC cell proliferation by the AMPK/PDGFRβ signaling pathway. A, The cell viability of HepG2 cells treated with phenformin and lenvatinib alone or in combination for 72 h were evaluated by MTT assays; B, CI among the combination therapy of lenvatinib and phenformin in HepG2 cells was calculated using CompuSyn software. If CI > 1, it denotes antagonism; if CI < 1, it denotes synergism; C, The colony-formation ability of HepG2 cells analysis. Cells were cultured with the absence or presence of drugs for 10–12 days; D, The cell cycle analysis in HepG2 cells, which were treated with lenvatinib (4 µM), phenformin (100 µM), or combination at the indicated concentrations for 48 h; E, WB analysis of PDGFRβ, AMPK and p-AMPK protein in HepG2 cells. HepG2 cells were treated with lenvatinib (4 µM), phenformin (100 µM), or combination at the indicated concentrations for 24 h. GAPDH served as a loading control; F, WB analysis of key protein in ERK signaling pathway and cell cycle signaling pathway in HepG2 cells. Cells were treated with lenvatinib (4 µM), phenformin (100 µM), or combination at the indicated concentrations for 24 h. Data are mean ± s.e.m. n = 3. *P < 0.05; **P < 0.01; ***P < 0.001; ns, not significant
Fig. 7
Fig. 7
Evaluation of the efficacy and safety of combination with phenformin and lenvatinib in vivo. A–C, The lenvatinib in combination with phenformin significantly suppresses tumour growth in xenograft models derived from HepG2 cells. After tumour establishment, mice were treated with vehicle, lenvatinib (3.2 mg/kg), phenformin (80 mg/kg) or combination for 14 days, respectively. A, Representative tumour images of each group of HepG2 xenografts at the end of treatment. B, Tumour weight of each group of HepG2 xenografts. C, Growth curves of each group of HepG2 xenografts. Data are mean ± s.e.m. n = 5 mice per group. Two-way ANOVA with Turkey multiple comparisons correction; D, WB analysis of PDGFRβ, AMPK and p-AMPK protein in xenografts. GAPDH served as a loading control. Data are mean ± s.e.m. n = 3; E, WB analysis of key protein in ERK signaling pathway and cell cycle signaling pathway in xenografts. n = 3; F, Representative images of H&E staining of livers and kidneys in each group of mice. Scale bar = 50 μm. Data are mean ± s.e.m. *P < 0.05, **P < 0.01, *** P < 0.001, ns, not significant
Fig. 8
Fig. 8
Scheme illustrating that the combination therapy with phenformin and lenvatinib further inhibits HCC cell proliferation via the AMPK-mediated PDGFRβ degradation

References

    1. Vogel A, Meyer T, Sapisochin G, Salem R, Saborowski A. Hepatocellular carcinoma. Lancet. 2022;400(10360):1345–62. - PubMed
    1. Han B, Zheng R, Zeng H, Wang S, Sun K, Chen R, Li L, Wei W, He J. Cancer incidence and mortality in China, 2022. J Natl Cancer Cent. 2024;4(1):47–53. - PMC - PubMed
    1. Dutta R, Mahato RI. Recent advances in hepatocellular carcinoma therapy. PHARMACOL THERAPEUT. 2017;173:106–17. - PMC - PubMed
    1. Ohri N, Kaubisch A, Garg M, Guha C. Targeted therapy for hepatocellular carcinoma. Semin Radiat Oncol. 2016;26(4):338–43. - PubMed
    1. Zhu Y, Sun P, Wang K, Xiao S, Cheng Y, Li X, et al. Efficacy and safety of lenvatinib monotreatment and lenvatinib-based combination therapy for patients with unresectable hepatocellular carcinoma: a retrospective, real-world study in China. CANCER CELL INT. 2021;21(1):503. 10.1186/s12935-021-02200-7 - PMC - PubMed