. 2025 Oct 17;23(1):1127.
doi: 10.1186/s12967-025-07208-5.

Targeting PURPL RNA enabled rejuvenation of senescence cells via epigenetic reprogramming

Affiliations

Targeting PURPL RNA enabled rejuvenation of senescence cells via epigenetic reprogramming

Jie Wang et al. J Transl Med. .

Abstract

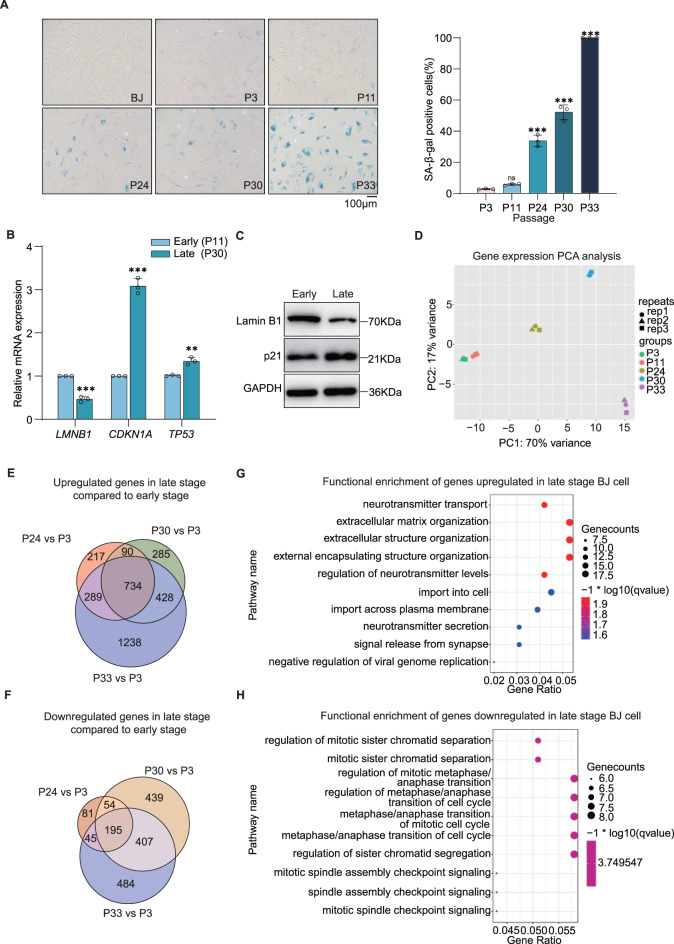
Cellular senescence is a fundamental driver of ageing and age-related diseases, characterized by irreversible growth arrest and profound epigenetic alterations. While long non-coding RNAs (lncRNAs) have emerged as key regulators of senescence, their potential for senescent cell rejuvenation remains unexplored. Here, we identify the ageing-associated lncRNA PURPL as an epigenetic regulator that controls cellular rejuvenation through H3K9me3-mediated transcriptional silencing. CRISPRi-mediated PURPL depletion produces striking rejuvenation effects, resulting in restored youthful cell morphology, as well as suppression of senescence markers such as p21 and SA-β-gal. Conversely, PURPL overexpression accelerates cellular senescence, recapitulating the transcriptional and phenotypic hallmarks of ageing. Mechanistically, nuclear-localized PURPL regulates H3K9me3 deposition at 411 genomic loci including SERPINE1 (PAI-1) and EGR1, which are key senescence drivers. PURPL-mediated H3K9me3 loss at these loci derepresses their transcription, establishing a pro-senescence gene expression program. These findings reveal that PURPL is an epigenetic modulator of senescence and highlight its potential as a therapeutic target for age-related pathologies.

Keywords: Cellular senescence; H3K9me3; Histone modification; Long non-coding RNA; PURPL.


Conflict of interest statement

Declarations. Competing interests: The authors declare no competing interests.

Figures

Fig. 1
Fig. 1
Replicative senescence characterization in BJ human fibroblasts. (A) Left: Representative images of senescence-associated β-galactosidase (SA-β-gal) staining in BJ cells at different passages (P3, P11, P24, P30 and P33), scale bar, 100 μm. Right: quantification analysis of SA-β-gal-positive cells at different passages (data are shown as the mean ± s.e.m., n = 3, p values were assessed using two-tailed Student’s t-tests, ns, not significant, ***p < 0.001). (B, C) senescence-associated marker expression in young (P11) and senescent (P30) BJ cells. B, RT‒qPCR quantification of LMNB1, CDKN1A (p21), and TP53 mRNA levels (data are shown as the mean ± s.e.m., n = 3, p values were assessed using two-tailed Student’s t-tests, **p < 0.01, ***p < 0.001). C, Immunoblot analysis of LMNB1 and p21 protein expression, GAPDH serves as loading control. (D) Principal component analysis (PCA) of transcriptomes profiles from BJ cells at indicated passages (P3–P33), with shapes denoting biological replicates. (EH) Transcriptomic changes during senescence. Venn diagrams depict numbers of upregulated (E) and downregulated (F) genes in late stages (P24–P33) versus early stage (P3) (up, Padj < 0.05, log2FC > 1; down, Padj < 0.05, log2FC < -1). Bubble plots show significantly enriched GO terms for upregulated ( G) and downregulated (H) genes in late stage BJ cell. Replicative senescence characterization in IMR-90 human fibroblasts. (A) Representative images of senescence-associated β-galactosidase (SA-β-gal) staining in IMR-90 cells at different passages (P5, P9, P11, and P13), scale bar, 100 μm. (B) Quantification analysis of SA-β-gal-positive cells at different passages (Data are shown as the mean ± s.e.m., n = 3, p values were assessed using two-tailed Student’s t-tests, ***p < 0.001). (C, D) Senescence-associated marker expression in young (P5) and senescent (P13) IMR-90 cells. C, RT‒qPCR quantification of LMNB1, CDKN2A (p16) mRNA levels (Data are shown as the mean ± s.e.m., n = 3, p values were assessed using two-tailed Student’s t-tests, **p < 0.01, ***p< 0.001). D, Immunoblot analysis of LMNB1 and p16 protein expression, GAPDH serves as loading control
Fig. 2
Fig. 2
Identification and functional validation of senescence-associated lncRNA PURPL. (A, B) cluster analysis of differentially expression lncRNAs across BJ cell passages (P3–P33) or IMR-90 cell passages (P5–P13). Z-scores indicate relative expression levels (red: high; blue: low). (C) Venn diagram displays the number of common lncRNAs identified by BJ-Cluster4 upregulation lncRnas (left, n = 435), IMR-90-Cluster3 upregulation lncRNAs (middle, n = 227), and doxorubicin-induced upregulation lncRNAs (right, n = 94). (D) Tissue-specific expression profiles of PURPL in bladder and sigmoid colon across age groups (20–79 years). Expression levels are presented as log2(TPM). (E) RT‒qPCR validation of CRISPRi-mediated PURPL knockdown efficiency (data are shown as the mean ± s.e.m., n = 3, p values were assessed using two-tailed Student’s t-tests, ***p < 0.001). (F, G) senescence marker expression after PURPL knockdown. F, qRT‒PCR quantification of LMNB1, CDKN1A (p21) mRNA levels (data are shown as the mean ± s.e.m., n = 3, p values were assessed using two-tailed Student’s t-tests, **p < 0.01, ***p < 0.001). G, Immunoblot analysis of LMNB1 and p21 protein expression, GAPDH serves as loading control. (H) SA-β-gal staining and quantification of empty vector control (sgCtrl) and PURPL knockdown (sgPURPL#1/2) BJ cells (data are shown as the mean ± s.e.m., n = 6, p values were assessed using two-tailed Student’s t-tests, ***p < 0.001), scale bar, 100 μm. Doxorubicin-induced senescence in BJ human fibroblasts. (A) Left: SA-β-gal staining of BJ cells treated with DMSO (control) or 50 ng/mL doxorubicin (Dox). Scale bar, 100 μm. Right: Quantification of SA-β-gal-positive cells at treated with DMSO or 50 ng/mL Dox (Data are shown as the mean ± s.e.m., n = 3, p values were assessed using two-tailed Student’s t-tests, ***p < 0.001). (B) RT‒qPCR analysis of senescence marker mRNA expression post-Dox treatment (Data are shown as the mean ± s.e.m., n = 3, p values were assessed using two-tailed Student’s t-tests, ***p < 0.001). (C) Volcano plot of differentially expressed lncRNAs following Dox treatment. Upregulated lncRNAs are marked in red dots, while downregulated lncRNAs are highlighted in blue
Fig. 3
Fig. 3
PURPL overexpression accelerates cellular senescence. (A) RT‒qPCR analysis showing increased PURPL expression in BJ cells post-overexpression (data are shown as the mean ± s.e.m., n = 3, p values were assessed using two-tailed Student’s t-tests, ***p < 0.001). (B, C) senescence marker expression after PURPL overexpression. B, RT‒qPCR quantification of LMNB1, CDKN1A (p21) mRNA levels (data are shown as the mean ± s.e.m., n = 3, p values were assessed using two-tailed Student’s t-tests, **p < 0.01, ***p < 0.001). C, Immunoblot analysis of LMNB1 and p21 protein expression, GAPDH serves as loading control. (D) SA-β-gal staining of ctrl and PURPL-overexpressing cells. Left: SA-β-gal staining in PURPL-overexpressing (PURPL#1/2-OE) compared to empty vector control (ctrl) BJ cells, scale bar, 100 μm. Right: quantification shows significantly increased SA-β-gal-positive cells upon PURPL overexpression (data are shown as the mean ± s.e.m., n = 6, p values were assessed using two-tailed Student’s t-tests, ***p < 0.001). (E) Volcano plot illustrating mRNA enrichment in PURPL#1 overexpressing BJ cells. Upregulated mRNAs are marked in red dots, while downregulated mRNAs are highlighted in blue. (F, G) bubble plot showing enriched GO biological process terms for up (F) and downregulated (G) genes in BJ cells overexpressing PURPL (PURPL#1-OE) compared to empty vector control (ctrl). Senescence-Associated lncRNA PURPL: Expression Dynamics and CRISPRi Targeting Strategy. (A) Expression dynamics of senescence-upregulated lncRNAs across BJ cell passages (P3–P33). Data show normalized counts ± s.d. (B) Tissue-specific expression profiles of PURPL in spleen and uterus across age groups (20–79 years). Expression levels are presented as log2(TPM). (C) Schematic of CRISPRi-mediated PURPL knockdown strategy
Fig. 4
Fig. 4
Mechanistic insights into PURPL function. (A) Subcellular localization of PURPL by qPCR. NEAT1 (nuclear) and GAPDH (cytoplasmic) serve as controls. (B) The venn diagram displays the number of common lncRNAs identified by H3K9me3-associated lncRNAs (left, n = 394), BJ doxorubicin-induced upregulation lncRNAs (middle, n = 94), and BJ-Cluster4 upregulation lncRNAs (right, n = 435). (C) Immunoblot analysis of H3K9me3 levels in PURPL-knockdown (sgPURPL#1/2) BJ cells versus controls (sgCtrl) and PURPL -overexpressing (PURPL#1/2-OE) versus controls (ctrl). H3 serves as loading control. (D) The venn diagram shows the number of common genes by intersecting the list of downregulated genes(n = 757, Padj < 0.05, log2FC < -0.5) and genes proximal to H3K9me3 peak-enriched regions (n = 411) from the PURPL-knockdown (E, F) genome browser shots show the distribution of ChIP-seq and RNA-seq signals from samples of sgCtrl and sgPURPL#1/2, RNA-seq signals from BJ P3 and P33 on SERPINE1 (E) and EGR1 (F) gene. PURPL overexpression functional analyses. (A) PCA of transcriptomes from PURPL-overexpressing (PURPL#1/2-OE) and empty vector control (Ctrl) BJ cells, shapes represent biological replicates. (B) Volcano plot illustrating mRNA enrichment in PURPL#2 overexpressing BJ cells. Upregulated mRNAs are marked in red dots, while downregulated mRNAs are highlighted in blue. (C, D) Bubble plot showing enriched GO biological process terms for up (C) and downregulated (D) genes in BJ cells overexpressing PURPL (PURPL#2-OE) compared to empty vector control (Ctrl)
Fig. 5
Fig. 5
Mechanistic model of PURPL-mediated epigenetic regulation in cellular senescence. In proliferating cells, PURPL expression is maintained at low levels. As cells undergo repeated divisions, PURPL is up-regulated and accumulates in the nucleus, where it likely interacts with transcription activators such as ZNF236, facilitating the recruitment of epigenetic modifiers. This process promotes the depletion of the repressive histone mark H3K9me3 at specific genomic loci—including those of senescence-associated genes such as SERPINE1 and EGR1. This epigenetic derepression leads to their transcriptional activation and drives the senescent phenotype, marked by reduced Lamin B1, elevated p21, and increased SA-β-gal activity. Notably, knockdown of PURPL restores H3K9me3 levels at these loci, suppresses senescence-associated gene expression, and facilitates cellular rejuvenation. Subcellular distribution and epigenetic regulation of SERPINE1 and EGR1 by PURPL. (A) Schematic of nuclear-cytoplasmic fractionation. (B) RT‒qPCR analysis of PURPL, SERPINE1, EGR1 and LMNB1 expression levels in HUVECs following PURPL overexpression. (Data are shown as the mean ± s.e.m., n = 3, p values were assessed using two-tailed Student’s t-tests, *p < 0.05, **p < 0.01, ***p < 0.001). (C) Genomic loci and epigenetic profiles of SERPINE1 and EGR1. Track displays include: ReMap ChIP-seq peaks (transcription factor binding sites), H3K27ac histone marks (active enhancer/promoter regions). (D) Identification of PURPL-associated proteins by CARPID. Volcano plot showing enrichment of PURPL-associated proteins in BJ cells. The x-axis shows the log2 fold change in protein enrichment (PURPL gRNAs versus non-targeting gRNA), and the y-axis shows the –log10 p value. Significantly enriched proteins are marked in orange (p-value < 0.05, fold change > 2, and n = 3 independent experiments). The transcriptional activators ZNF236 and MTDH are among the PURPL-associated candidates. N.S., not significant

References

    1. Lopez-Otin C, Blasco MA, Partridge L, Serrano M, Kroemer G. Hallmarks of aging: An expanding universe. Cell. 2023;186:243–78. - PubMed
    1. Di Micco R, Krizhanovsky V, Baker D. d’Adda di fagagna F: cellular senescence in ageing: From mechanisms to therapeutic opportunities. Nat Rev Mol cellbiol. 2021;22:75–95. - PMC - PubMed
    1. Dimri GP, Lee X, Basile G, Acosta M, Scott G, Roskelley C, Medrano EE, Linskens M, Rubelj I, Pereira-Smith O, et al. A biomarker that identifies senescent human cells in culture and in aging skin in vivo. Proc Natl Acad Sci U S A. 1995;92:9363–67. - PMC - PubMed
    1. Karimian A, Ahmadi Y, Yousefi B. Multiple functions of p21 in cell cycle, apoptosis and transcriptional regulation after DNA damage. DNA Repair (amst). 2016;42:63–71. - PubMed
    1. Kumari R, Jat P. Mechanisms of cellular senescence: cell cycle arrest and senescence associated secretory phenotype. Front. Cell Dev.Biol. 2021;9:645593. - PMC - PubMed

MeSH terms

LinkOut - more resources