. 2025 Oct 19;13(10):e012491.
doi: 10.1136/jitc-2025-012491.

Stromal cells modulate innate immune cell phenotype and function in colorectal cancer via the Sialic acid/Siglec axis

Affiliations

Stromal cells modulate innate immune cell phenotype and function in colorectal cancer via the Sialic acid/Siglec axis

Aoise O'Neill et al. J Immunother Cancer. .

Abstract

Background: The immunosuppressive tumor microenvironment reduces immune response effectiveness in stromal-rich tumors, including consensus molecular subtype 4 colorectal cancer (CRC). Mesenchymal stromal cells (MSCs), precursors to cancer-associated fibroblasts (CAFs), promote cancer progression by suppressing anti-tumor immune responses. Hypersialylation of glycans on tumors engages Siglec receptors on immune cells, driving immune dysfunction, but its role in stromal-mediated suppression of innate immunity remains unclear.

Methods: Sialylation, Sialic acids and Siglec ligands were measured on CRC tissue, primary human normal-associated fibroblasts (NAFs), CAFs, and tumor-conditioned MSCs (MSCTCS) using transcriptional profiles, immunohistochemistry and flow cytometry, respectively. The effect of stromal cell sialylation on macrophages and NK cells was assessed in ex vivo human primary stromal and immune cell co-cultures, and expression of Siglec-10 and immune cell phenotype markers and function was measured by flow cytometry and real-time imaging. Using an immunocompetent Balb/c CT26 mouse model, we induced tumors with/without conditioned stromal cells, with/without pretreatment of stromal cells with sialyltransferase inhibitor (3FAX) or sialidase (E610). We assessed the effect of stromal cell sialylation on macrophages and NK cells in the tumor and secondary lymphoid tissues by flow cytometry.

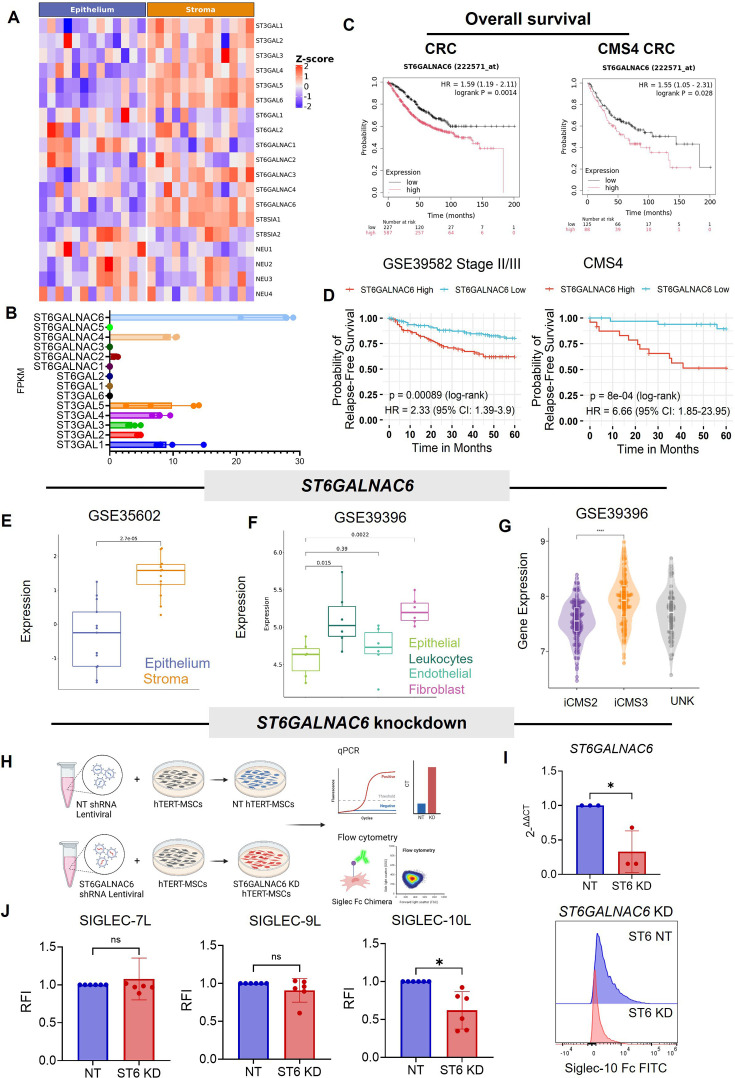
Results: Stromal cells, including CAFs, in CRC tumors are highly sialylated compared with epithelial cancer cells and are associated with high expression of the sialyltransferase ST6GALNAC6. Genetic knockdown of ST6GALNAC6 reduced the expression of stromal cell Siglec-10 ligands in MSCs. CAFs and MSCTCS induced Siglec-10 on macrophages and NK cells and impaired macrophage phagocytosis and NK cell cytotoxicity. Sialidase treatment reduced Siglec-10 expression, restoring macrophage and NK cell antitumor functions. In vivo and ex vivo, desialylation of stromal cells increased macrophage activation (CD11b+CD80+) and reduced immunosuppressive marker expression (CD206, PD-L1, Siglec-G) in lymphoid tissues, indicating sustained systemic anti-tumor immunity. Intratumoral NK cells exhibited high Siglec-G expression and impaired cytotoxicity, and granzyme B expression significantly increased with sialidase treatment of stromal cells. In an inflammatory tumor model, inflammatory tumor-conditioned MSCs (MSCiTCS) promoted metastasis and Siglec-G induction on NK cells and macrophages, both reversed by sialyltransferase inhibition, underscoring the effects of stromal modulation of innate immune cell function in inflammatory tumors.

Conclusions: Stromal cell sialylation modulates innate immune suppression in CRC via the sialic acid/Siglec axis. Targeting stromal sialylation restores NK cytotoxicity and macrophage activation, offering novel insights that may shape therapeutic strategies for reversing immunosuppression in stromal-rich tumors.

Keywords: Colon Cancer; Immune modulatory; Immunosuppression; Sialic acid/Siglec axis; Stroma; Tumor microenvironment - TME.


Conflict of interest statement

Competing interests: LP, JW-YC and LC are employees and shareholders of Palleon Pharmaceuticals. MO’D is a founder of ONK Therapeutics and a member of its Board of Directors and is coinventor on two related patents (US20210186999A1 and US2017032727899A1). TR and AER are coinventors on patent US20210186999A1.

Figures

Figure 1
Figure 1. Sialylation is upregulated in CMS4 colorectal cancer. (A) Transcriptional profiles of stage II/III untreated colon cancer samples (GSE39582) were retrieved and CMS classified (n=258; CMS1=49, CMS2=75, CMS3=35, CMS4=58). (B) Expression heatmap of transcriptional signatures of glycosylation and sialylation-related genes across CMS1–4 subtypes. (C) Single sample gene set enrichment analysis (ssGSEA) of pathways associated with glycosylation, protein sialylation, sialic acid binding, and α2,3 sialyltransferase activity. (D) Immunohistochemical (IHC) staining images of lectins SNA-I and MAL-II in CRC tissue sections and their quantification in epithelial and stromal regions. (E) Experimental outline of MSC conditioning with tumor cell secretome (TCS) and TNF-α-treated inflammatory TCS (iTCS). (F) Heatmaps showing MFI for SNA-I and MAL-II expression in CRC cell lines, unconditioned MSC, MSCTCS and MSCiTCS. Data are mean±SD; *p<0.05, **p<0.01, ***p<0.001, ****p<0.0001 by Wilcoxon rank-sum test, CMS4 as the reference group (C), paired t-test (D) or one-way ANOVA followed by Tukey’s post hoc test (F). ANOVA, analysis of variance; CMS4, consensus molecular subtype 4; CRC, colorectal cancer; MFI, median fluorescence intensity; MSC, mesenchymal stromal cell.
Figure 2
Figure 2. Sialyltransferases are upregulated in colorectal cancer, and targeting ST6GALNAC6 reduces Siglec-10 ligand expression by stromal cells. (A) Expression heatmap of sialyltransferase and neuraminidase genes in stromal and epithelial compartments in human CRC samples (n=13) created by ConfoundR (dataset GSE35602). (B) Fragments per kilobase of exon per million mapped fragments (FPKM) values of sialyltransferase genes in human CRC-derived cancer-associated fibroblasts (CAFs) (n=4), analyzed by bulk RNA sequencing. (C) Overall survival (OS) analysis for ST6GALNAC6 high-expression and low-expression in CRC (left) and CMS4 CRC samples (right). Kaplan-Meier survival curve showing log-rank test p value generated using KMPlotter. (D) Kaplan-Meier plot showing probability of relapse-free survival of ST6GALNAC6 high-expression and low-expression in stage II/III untreated CRC (left) and in CMS4 CRC samples (right) (both from GSE39582 dataset). Kaplan-Meier survival curves showing log-rank test p value. (E, F) ST6GALNAC6 gene expression in different cells of CRC samples created by ConfoundR (datasets GSE35602 and GSE39396). (G) ST6GALNAC6 gene expression in iCMS2 and iCMS3 CRC samples (dataset GSE39396). (H) Experimental outline for ST6GALNAC6 shRNA knockdown in hTERT-MSCs. (I) Relative expression of ST6GALNAC6 in hTERT-MSCs after shRNA knockdown (ST6 KD) compared with non-targeting (NT) shRNA controls (n=3). (J) Relative fluorescence intensity (RFI) (normalized to NT hTERT-MSCs) of Siglec-7, Siglec-9, and Siglec-10 ligand expression in ST6GALNAC6 KD (ST6 KD) hTERT-MSCs (n=6) and representative overlay histograms for Siglec-10 ligand expression. Data are mean±SD; *p<0.05, ****p<0.0001 using Wilcoxon rank-sum test (E–G) or paired t-test (I, J). CRC, colorectal cancer; hTERT, human telomerase reverse transcriptase; MSC, mesenchymal stromal cell.
Figure 3
Figure 3. Stromal-rich colorectal cancer enriched for Siglec-10 and Siglec-10 ligand and associated with poor prognosis. (A) Waterfall plot depicting high and low Siglec-10 expression across CMS subtypes (dataset GSE39582). (B, C) Siglec-10 expression levels across CMS subtypes, in high fibroblast (HiFi) and low fibroblast (LoFi) CRC samples (dataset GSE39582). (D) Heatmap showing correlation between stromal cell genes (ACTA2, PDPN, FAP), Siglec-7, Siglec-9 and Siglec-10 receptor, and ST6GALNAC6 gene. (E, F) Kaplan-Meier plots showing probability of relapse-free survival of Siglec-10 high-expression and low-expression in stage II/III untreated CRC and in CMS4 CRC samples (both from GSE39582 dataset). Kaplan-Meier survival curves showing log-rank test p value. (G) Median fluorescence intensity (MFI) of Siglec-10 expression by immune cell subsets in peripheral blood mononuclear cells (PBMCs) from CRC samples (n=8). (H) MFI of Siglec-10 Fc chimera (Siglec-10 ligand) expression by HCT116 and SW480 CRC cells and MSCiTCS (n=3). (I) MFI of Siglec-10 Fc chimera (Siglec-10 ligand) expression by CAFs and normal-associated fibroblasts (NAFs) ± 3FAX pre-treatment (n=5–7) and overlay histograms showing representative CAF and HCT116 expression. (J) Confocal microscopy images of multiplex immunofluorescence staining of CD24 (pink) and Siglec-10 (green) in CRC tissue sections (DAPI nuclear staining shown in blue). (K) Relative fluorescence intensity (RFI: relative to MSCs) of CD24 and CD52 expression by MSC, MSCTCS and MSCiTCS. Data are mean±SD; *p<0.05, **p<0.01, ***p<0.001, ****p<0.0001 by Wilcoxon rank-sum test (B, C), non-parametric Kruskal-Wallis test (G), unpaired Welch’s t test (H) and ordinary one-way ANOVA followed by Tukey’s post hoc test (I, K). ANOVA, analysis of variance; CAF, cancer-associated fibroblast; CMS, consensus molecular subtype; CRC, colorectal cancer; RFI, relative fluorescence intensity; TCS, tumor cell secretome.
Figure 4
Figure 4. Stromal cells induce Siglec-10 expression on primary human macrophages and are associated with suppressed tumor cell phagocytosis. (A) Experimental outline depicting macrophage isolation from PBMCs, cytokine activation, and indirect co-culture with cancer or stromal cell secretome. (B) RFI (relative to Mφ alone) of Siglec-10 expression on naïve, IFN-γ+IL-4, and IL-4 alone activated macrophages after indirect co-culture with HCT116 TCS or iTCS (n=4) with representative overlay histograms. The fluorescence minus one (FMO) control is represented by a black line histogram. (C) RFI (relative to Mφ alone) of Siglec-10 expression in naïve, IFN-γ+IL-4, and IL-4 alone activated macrophages after indirect co-culture with MSCTCS/iTCS secretome (n=3) with representative overlay histogram. The FMO control is represented by a black line histogram. (D) Experimental outline of NAF and CAF direct co-culture with human PBMCs and sialic acid targeting with 3FAX or E610. (E) MFI of Siglec-10 expression by CD11b+ macrophages after co-culture with NAFs and CAFs with or without E610 and 3FAX treatment (n=4). (F) % of red tumor cell uptake by macrophages was measured by live cell imaging over time and plotted as % of total cells. Representative graph showing % phagocytosis analyzed by Incucyte live cell imaging of pro-inflammatory macrophages or pro-inflammatory macrophages conditioned with TCS/iTCS (left) or MSCTCS/MSCiTCS secretome (right) over 24 hours. (G) Bar graph of the same experiment described in (F) showing quantification of phagocytosis at the 18 hour timepoint (n=2). Data are mean±SD; *p<0.05, **p<0.01, ***p<0.001, ****p<0.0001 using one-way ANOVA followed by Tukey’s post hoc test. ANOVA, analysis of variance; CAF, cancer-associated fibroblast; FMO, fluorescence minus one; MFI, median fluorescence intensity; MSC, mesenchymal stromal cell; NAF, normal-associated fibroblast; PBMCs, peripheral blood mononuclear cells; RFI, relative fluorescence intensity; TCS, tumor cell secretome.
Figure 5
Figure 5. CAFs induce Siglec-10 on primary human NK cells, and targeting CAF sialylation increases NK cell anti-tumor function. (A) Frequency (%) of Siglec-10 expression by CD3+ T cells, CD4+ T cells, CD8+ T cells, and CD56+ NK cells (n=8). (B) Scatter plot showing the correlation between CD56 (NCAM1) and Siglec-10 mRNA expression in a cohort of 394 CRC patient samples from the TCGA database and analyzed using cBioPortal (https://www.cbioportal.org). (C) Experimental outline showing direct co-culture of NAFs or CAFs with stimulated human PBMCs. (D) Flow cytometry dot plots showing Siglec-10 expression by NK cells either cultured alone or following co-culture with CAFs. (E) (i) Frequency (%) (left) and MFI (right) of Siglec-10 expression by CD56+ NK cells after co-culture with NAFs or CAFs with or without pre-treatment with 3FAX (n=4); (ii) Frequency (%) (left) and MFI (right) of Siglec-10 expression by CD56+ NK cells after co-culture with NAFs or CAFs pretreated and cultured directly ± E610 (n=4). (F) Experimental outline showing NK cell isolation from PBMCs and direct co-culture with NAFs or CAFs, with or without 3FAX or E610 pre-treatment, followed by cytotoxicity assay setup. (G) Frequency (%) (left) and MFI (right) of Siglec-10 expression by CD56+ NK cells after direct co-culture with NAFs or CAFs (n=4). (H) Percentage (%) of NK cytotoxicity, measured as the percentage of HCT116 cancer cell killing by NK cells post-co-culture with NAFs or CAFs, with or without 3FAX or E610 pre-treatment (n=5). Data are mean±SD; *p<0.05, **p<0.01, ***p<0.001; ****p<0.0001 by one-way ANOVA followed by Tukey’s post hoc test (A, E) and paired t-test with Wilcoxon matched-pairs test (G, H). ANOVA, analysis of variance; CAF, cancer-associated fibroblast; MFI, median fluorescence intensity; NAF, normal-associated fibroblast; PBMCs, peripheral blood mononuclear cells.
Figure 6
Figure 6. Targeting stromal cell sialylation increases Siglec-G expression by murine macrophages in vivo. (A) Experimental outline of murine tumor model. Balb/c mice were injected subcutaneously in the right flank with either CT26 cells alone, CT26+MSCTCS, CT26+MSCTCS 3FAX or CT26+MSCTCS E610. Tumors, spleens, and draining lymph nodes (DLNs) were harvested 21 days post-injection. (B) Tumor volume measured on day 13, day 16, and day 21. (C) Frequency (%) of CD206, PD-L1, and Siglec-G expression by CD45+CD11b+ macrophages in tumors, spleens, and DLNs of mice bearing CT26 tumors at day 21 post-injection. (D) (i) Frequency (%) of CD80 expression by CD45+CD11b+ macrophages in murine tumors at day 21 post-injection. Representative overlay histogram (right). (ii) Frequency (%) of CD80 expression by CD45+CD11b+ macrophages in DLNs and spleens of tumor-bearing mice at day 21 post-injection. (E) (i) Frequency (%) of PD-L1 expression by CD45+CD11b+ macrophages in murine tumors at day 21 post-injection. Representative overlay histogram shown on the right. (ii) Frequency (%) of PD-L1 expression by CD45+CD11b+ macrophages in DLNs and spleens of tumor-bearing mice (F) (i) Frequency (%) of Siglec-G expression by CD45+CD11b+ macrophages in murine tumors. Representative overlay histogram (right). (ii) Frequency (%) of Siglec-G expression by CD45+CD11b+ macrophages in DLNs and spleens of tumor-bearing mice. n=4–6 of biological replicates. (G) (i) Frequency (%) of CD11b+CD80+ cells in naïve murine bone marrow-derived macrophages (mBMDM) conditioned with TCS or MSCTCS (left) and a scatter plot showing the correlation between CD80 expression and percentage phagocytosis (right). (ii) Percentage of CD11b+CFSE+ cells that represent phagocytosis events measured by flow cytometry of naïve macrophages conditioned with TCS ± E610 sialidase. (H) Frequency (%) of CD11b+CD80+ cells in human monocyte-derived macrophage:MSC co-culture ± Siglec-10 blocking. n=3–7. Data are mean±SD; *p<0.05, **p<0.01, ***p<0.001, ****p<0.0001 by one-way ANOVA followed by Tukey’s post hoc test. ANOVA, analysis of variance; MSC, mesenchymal stromal cell; TCS, tumor cell secretome.
Figure 7
Figure 7. Targeting stromal cell sialylation in vivo increases NK cell granzyme B and reduces Siglec-G expression. (A) Frequency (%) of CD45+CD49b+ NK cells and NKG2D, Siglec-G, and granzyme B expression by CD45+CD49b+ NK cells in tumors, spleens, and DLNs of mice bearing CT26 tumors. (B) Representative flow cytometry contour plots and quantification of CD49b+ NK cells in murine tumors following injection of CT26 cells alone, CT26 + MSCTCS, CT26 + MSCTCS 3FAX or CT26 + MSCTCS E610 at day 21 post-injection. (C) (i) Representative flow cytometry contour plots and quantification of NKG2D expression by CD49b+ NK cells in murine tumors and (ii) DLNs. (D) Representative flow cytometry contour plots and quantification of Siglec-G expression by CD49b+ NK cells in murine tumors. (E) Representative flow cytometry contour plots (left) and quantification of granzyme B expression by CD49b+ NK cells in murine tumors (right). (F) Frequency (%) of Granzyme B (GZM-B) expression by CD49b+ NK cells in DLNs and spleens of tumor-bearing mice at day 21 post-injection. Data are mean±SD; *p<0.05, **p<0.01, ***p<0.001, ****p<0.0001 by one-way ANOVA followed by Tukey’s post hoc test. n=4–6 of biological replicates. ANOVA, analysis of variance; DLN, draining lymph nodes; MSC, mesenchymal stromal cell; TCS, tumor cell secretome.
Figure 8
Figure 8. Targeting sialylation of stroma in inflammatory in vivo models of CRC reduces Siglec-G expression in tumor-infiltrating macrophages and NK cells. (A) GSEA data depicting hallmark inflammatory responses and hallmark TNF-α signaling via NK-κB in CRC tumors comparing transcriptional signatures in fibroblasts versus epithelial cells. (B) Transcriptional signatures of the TNF-α signaling pathway across CMS subtypes 1–4. (C) Experimental outline of murine tumor model. Balb/c mice were injected subcutaneously in the right flank with either CT26 cells alone or co-injected with MSCiTCS or 3FAX pre-treated MSC (MSCiTCS 3FAX). Tumors, spleens, and DLNs were harvested 13 days post-injection. Frequency (%) of Siglec-G expression by CD11b+ macrophages or CD49b+ NK cells in (D) tumors, (E) DLNs, and (F) spleens of tumor-bearing mice. (G) Frequency (%) of Siglec-G expression by CD11b+CD206+ pro- and CD11b+MHC-II+ anti-inflammatory macrophages in tumors. (H) Percentage (%) of mice with invasive tumors at Day 13. Data are mean±SD; **p<0.01, ****p<0.0001 using one-way ANOVA followed by Tukey’s post hoc test. n=4–5 of biological replicates. ANOVA, analysis of variance; CMS, consensus molecular subtype; CRC, colorectal cancer; DLNs, draining lymph nodes; GSEA, gene set enrichment analysis; MSC, mesenchymal stromal cell.

References

    1. Siegel RL, Giaquinto AN, Jemal A. Cancer statistics, 2024. CA Cancer J Clin. 2024;74:12–49. doi: 10.3322/caac.21820. - DOI - PubMed
    1. Yan S, Wang W, Feng Z, et al. Immune checkpoint inhibitors in colorectal cancer: limitation and challenges. Front Immunol. 2024;15:1403533. doi: 10.3389/fimmu.2024.1403533. - DOI - PMC - PubMed
    1. Guinney J, Dienstmann R, Wang X, et al. The consensus molecular subtypes of colorectal cancer. Nat Med. 2015;21:1350–6. doi: 10.1038/nm.3967. - DOI - PMC - PubMed
    1. Ten Hoorn S, de Back TR, Sommeijer DW, et al. Clinical Value of Consensus Molecular Subtypes in Colorectal Cancer: A Systematic Review and Meta-Analysis. J Natl Cancer Inst. 2022;114:503–16. doi: 10.1093/jnci/djab106. - DOI - PMC - PubMed
    1. Peters NA, Constantinides A, Ubink I, et al. Consensus molecular subtype 4 (CMS4)-targeted therapy in primary colon cancer: A proof-of-concept study. Front Oncol. 2022;12:969855. doi: 10.3389/fonc.2022.969855. - DOI - PMC - PubMed

Substances