. 2025 Oct 20;15(1):426.
doi: 10.1038/s41398-025-03676-x.

Development of VEP-based biomarkers to assess plasticity states

Affiliations

Development of VEP-based biomarkers to assess plasticity states

Viktoria Galuba et al. Transl Psychiatry. .

Abstract

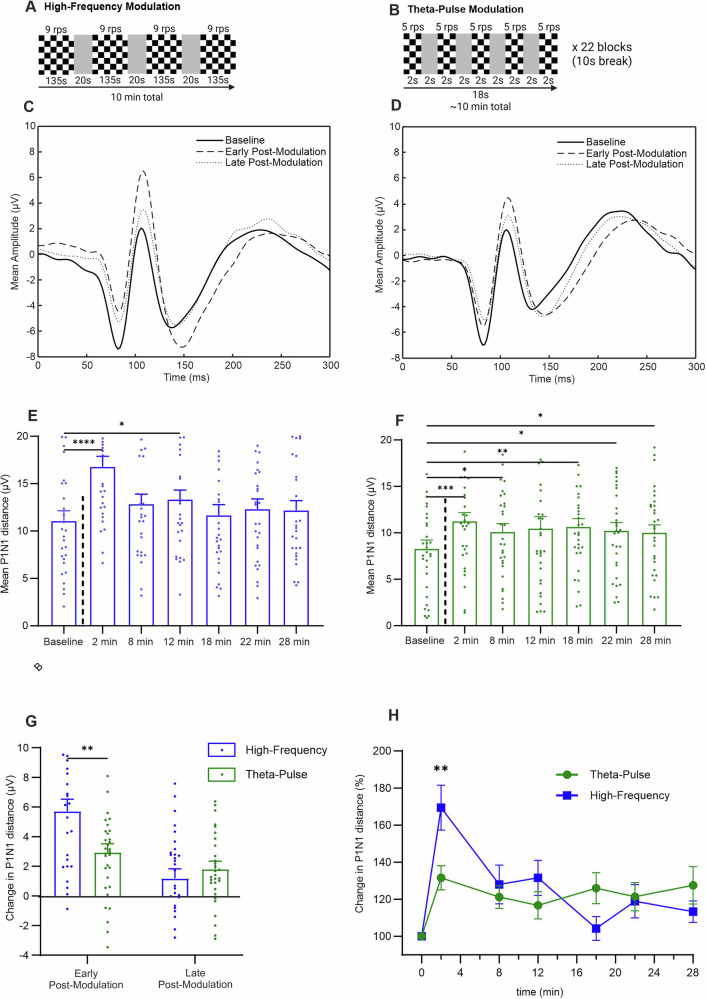
Disturbances in neuroplasticity are associated with many psychiatric and neurological disorders. Noninvasive electroencephalography (EEG) recordings of visually evoked potentials (VEPs) are promising for assessing plasticity in the human visual cortex, which may represent long-term potentiation (LTP). However, the variability in stimulation parameters limits the comparability and identification of optimal plasticity-inducing protocols. In this study, we systematically compared four VEP modulation protocols-low-frequency, repeated low-frequency, high-frequency, and theta-pulse stimulation-and assessed their effects on visual cortical plasticity. We analyzed 152 EEG recordings, where VEPs were evoked via a checkerboard reversal stimulus before and after low-frequency, repeated low-frequency, high-frequency, and theta-pulse stimulation. Changes in VEP amplitudes were measured from baseline to 2-28 min postmodulation. Low-frequency stimulation produced transient changes in plasticity, peaking at 2 min but dissipating within 12 min. Repeated low-frequency stimulation induced more sustained changes in plasticity, persisting for up to 22 min. High-frequency stimulation induced sharp but brief increases in plasticity indices, whereas theta-pulse stimulation was associated with moderate but prolonged changes in plasticity, lasting up to 28 min. These findings highlight the crucial influence of stimulation parameters on short- and long-term synaptic plasticity indices. Depending on the objective, a suitable induction protocol can be selected to optimize the desired effects, such as increasing sensitivity to drug effects or targeting longer-lasting plasticity outcomes. Optimized VEP paradigms have strong translational potential for assessing neuroplasticity deficits in individuals with psychiatric and neurodegenerative disorders, paving the way for the development of new biomarkers and therapeutic strategies.


Conflict of interest statement

Competing interests: The authors declare no competing interests. Ethical approval and informed consent: All procedures were performed in accordance with the Declaration of Helsinki and the relevant guidelines and regulations. The study was approved by the Ethics Committee of the Albert-Ludwigs-University Freiburg (approval numbers: 24-1237-S1 and 21-1113). Written informed consent was obtained from all participants prior to participation.

Figures

Fig. 1
Fig. 1. Overview of the study procedures.
A Study flowchart; B Schematic presentation of the VEP-related plasticity paradigm, including the block titles, duration, presentation frequency and time of block onset. The duration of the modulation blocks differed among the protocols. C Schematic representation of a pattern reversal VEP and its components.
Fig. 2
Fig. 2. Comparison of the effects of the low-frequency and repeated low-frequency modulation protocols.
A and B Schematic representations of the experimental timeline for each modulation phase; C and D Grand average VEP traces at baseline, in the early postmodulation period (2 min) and in the late postmodulation period (Ø 22 and 28 min) for the low-frequency (n = 57) and repeated low-frequency (n = 34) protocols; E Mean P1N1 was significantly changed by the low-frequency modulation from baseline to 2 min (p < 0.0001), 8 min (p = 0.014) and 12 min postmodulation (p = 0.0013); F Mean P1N1 was significantly changed by the repeated low-frequency modulation from baseline to 2 min (p < 0.0001), 8 min (p = 0.0075), 12 min (p = 0.0465) and 22 min postmodulation (p = 0.0005); G Mean P1N1 change (baseline value subtracted from postmodulation value) was significantly greater during late postmodulation phases (Ø 22 and 28 min) using the repeated low-frequency modulation protocol (p = 0.0011); H Post hoc comparison of baseline corrected changes (%) between protocols revealed a significantly greater percentage change after repeated low-frequency modulation at 8 min (p < 0.0001) and 22 min postmodulation (p = 0.0054). The data are presented as the means ± SEMs. *p < 0.05, **p < 0.01, ***p < 0.001, ****p < 0.0001.
Fig. 3
Fig. 3. Comparison of the effects of the high-frequency and theta-pulse modulation protocols.
A and B Schematic representation of the experimental procedure for the individual modulation phases; C and D Grand average VEP traces at baseline, in the early postmodulation period (2 min) and in the late postmodulation period (Ø 22 and 28 min) for the high-frequency (n = 29) and theta-pulse stimulation (n = 32) protocols; E Mean P1N1 was significantly changed by the high-frequency modulation from baseline to 2 min (p < 0.0001) and 12 min postmodulation (p = 0.0215); F Mean P1N1 was significantly changed by the theta-pulse modulation from baseline to 2 min (p = 0.0002), 8 min (p = 0.0369), 18 min (p = 0.0054), 22 min (p = 0.0228), and 28 min postmodulation (p = 0.0373); G Mean P1N1 modulation (baseline value subtracted from postmodulation value) significantly differed between protocols in the early postmodulation period (2 min; p = 0.0083). Mean P1N1 modulation was not significantly different in the late postmodulation period (Ø 22 and 28 min; p = 0.5298). H Post hoc comparison of baseline corrected changes (%) between protocols revealed a significantly greater percentage change after repeated high-frequency modulation at 2 min postmodulation (p = 0.0129). The data are presented as the means ± SEMs. *p < 0.05, **p < 0.01, ***p < 0.001, ****p < 0.0001.
Fig. 4
Fig. 4. Temporal stability and modulation consistency of the P1N1 amplitude across different stimulation protocols.
AD Scatter plots showing the correlation between the P1N1 modulation in the early (2 min) and late (Ø 22 and 28 min) postmodulation periods for each protocol: A Low-frequency modulation (n = 57), B repeated low-frequency modulation (n = 34), C high-frequency modulation (n = 29), and D theta-pulse modulation (n = 32). Pearson correlation coefficients (r) and significance values are indicated for each protocol. E Bar graph depicting the mean change in the P1N1 amplitude (in µV) for early and late postmodulation time points across protocols. F Modulation consistency (ΔEarly-Late Modulation) across different stimulation conditions. Post hoc comparisons revealed significant differences between the low-frequency vs. theta-pulse (p = 0.0008) and high-frequency vs. theta-pulse (p = 0.0004) conditions. The data are presented as the means ± SEMs. *p < 0.05, **p < 0.01, ***p < 0.001.
Fig. 5
Fig. 5. Stimulation protocols and corresponding VEP changes.
All panels show schematic VEP traces with the premodulation trace indicated by the dashed line, along with the traces in the early and late postmodulation phases. Upper left: Low-frequency stimulation protocol. Upper right: Repeated low-frequency stimulation protocol. Lower left: High-frequency stimulation protocol. Lower right: Theta pulse stimulation protocol. These data demonstrate how different stimulation protocols can be used to assess various aspects of neuroplasticity and excitability.

References

    1. Appelbaum LG, Shenasa MA, Stolz L, Daskalakis Z. Synaptic plasticity and mental health: methods, challenges and opportunities. Neuropsychopharmacol. 2023;48:113–20. - PMC - PubMed
    1. von Bernhardi R, Bernhardi LE, Eugenín J. What is neural plasticity?. Adv Exp Med Biol. 2017;1015:1–15. - PubMed
    1. Citri A, Malenka RC. Synaptic plasticity: multiple forms, functions, and mechanisms. Neuropsychopharmacol. 2008;33:18–41. - PubMed
    1. Schulz PE, Fitzgibbons JC. Differing mechanisms of expression for short- and long-term potentiation. J Neurophysiol. 1997;78:321–34. - PubMed
    1. Bliss TV, Collingridge GL. A synaptic model of memory: long-term potentiation in the hippocampus. Nature. 1993;361:31–39. - PubMed

LinkOut - more resources