. 2025 Oct 20;16(1):9208.
doi: 10.1038/s41467-025-64215-2.

Maternal plasma cell-free RNA as a predictor of early and late-onset preeclampsia throughout pregnancy

Collaborators, Affiliations

Maternal plasma cell-free RNA as a predictor of early and late-onset preeclampsia throughout pregnancy

Nerea Castillo-Marco et al. Nat Commun. .

Abstract

Early- and late-onset preeclampsia (EOPE and LOPE) pose serious maternal-fetal risks, yet non-invasive early prediction remains challenging. In a prospective cohort of 9,586 pregnancies, we analyze trimester-specific plasma cell-free RNA (cfRNA) profiles from 42 EOPE and 43 LOPE cases versus 131 normotensive controls. Organ-specific transcriptomic shifts distinguish EOPE from LOPE. Predictive models based on cfRNA signatures identify EOPE up to 18.0 weeks before clinical onset in the first-trimester (T1) (AUC = 0.88), and 8.5 weeks in the second trimester (T2) (AUC = 0.89). LOPE is predicted 14.9 weeks in advance using T2 data (AUC = 0.90), while T1 performance is lower (AUC = 0.68). External validation confirms robust EOPE prediction (AUC = 0.87 at T1; 0.81 at T2) and acceptable LOPE performance (AUC = 0.63 at T1; AUC = 0.77 at T2). EOPE models are enriched for decidual transcripts, suggesting early maternal involvement; LOPE models reflect broader tissue contributions. These findings offer a path to early, non-invasive, subtype-specific preeclampsia risk stratification and prevention.


Conflict of interest statement

Competing interests: N.C-M., M.I., T.G-G., C.S. are inventors on a patent application (EP24383276.3) covering methods for determining the risk of preeclampsia. N.C-M., T.C., M.I., C.G-A., N.B-G., A.G-D., E.O-D., A.V., T.G.-G. are employees of iPremom Pregnancy Healthcare Diagnostics. C.S. is a founder of iPremom Pregnancy Healthcare Diagnostics. The remaining authors declare no conflict of interest.

Figures

Fig. 1
Fig. 1. Flowchart of the study.
A total of 9586 pregnant participants were recruited. After excluding participants due to selection failure and loss to follow-up, 8991 remained. Within this cohort, 237 (2,6%) individuals were diagnosed with preeclampsia, including 42 EOPE and 195 LOPE cases, while 1849 (20.6%) individuals had other pregnancy-related pathologies, and 6905 (76,8%) participants had no obstetric complications. For cfRNA analysis, we included all 42 EOPE cases, a subset of 43 LOPE cases and 131 normotensive controls, randomly selected from the matched cohort based on gestational age at sample collection, maternal age, parity, ethnicity, and BMI.
Fig. 2
Fig. 2. Overview of sample collection, preeclampsia diagnosis, and delivery time points across patient and control groups.
Bar graph illustrating the number of samples collected at each gestational week for the EOPE (a), LOPE (c) and control (e) groups. Color represents the time point of sample collection: T1 (9-14 gestational weeks); T2 (18–28 gestational weeks); T3 (at the time of preeclampsia diagnosis or >28 gestational weeks). Density plot showing the relative frequency of preeclampsia diagnosis and delivery across gestational weeks for the EOPE (b), LOPE (d) and control (f) groups.
Fig. 3
Fig. 3. CfRNA abundance by organ/tissue origin in EOPE, LOPE patients and controls.
a Number and proportion of cfRNA transcripts from organs/tissues implicated in preeclampsia, relative to Human Protein Atlas reference. b Box plots show cfRNA abundance scores by tissue of origin at each time point, calculated as the sum of log-transformed CPM-TMM normalised counts. Color indicates group. Horizontal lines represent medians; boxes, 25th–75th percentiles; whiskers extend to 1.5x interquartile range. Sample sizes for each time point and group are as follows: T1 (EOPE, n = 41; LOPE, n = 43; control, n = 129); T2 (EOPE, n = 40; LOPE, n = 41; control, n = 120); T3 (EOPE, n = 19 vs. control, n = 34; LOPE, n = 24 vs. control, n = 39). P-values were determined by Wilcoxon rank-sum test with two tails. Exact P-values for all comparisons are provided in Supplementary Table 3. *P < 0.05, **P < 0.01, ***P < 0.001, ****P < 0.0001.
Fig. 4
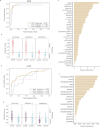
Fig. 4. Performance and feature importance of first trimester (T1) predictive models for EOPE and LOPE.
Receiver operating characteristic (ROC) curves for EOPE (a) and LOPE (d) models across internal validation (validation 1) and external validation (validation 2). The X-axis represents the False Negative Rate; the Y-axis, the True Positive Rate. Violin plots showing correctly and misclassified patients and controls based on the classifier score obtained from the predictive model for EOPE (b) and LOPE (e). The X-axis shows the real obstetric outcome; the Y-axis, the predicted outcome. Bar plot illustrating each cfRNAs contribution to EOPE (c) and LOPE (f) models. The X-axis shows the feature importance scores, which quantify the relative contribution of each cfRNA to the model’s predictions, with higher scores indicating features that play a more significant role in discriminating between outcomes. CfRNAs associated with DR are marked with an asterisk. AUC, area under the curve.
Fig. 5
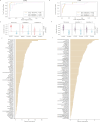
Fig. 5. Performance and feature importance analysis of second trimester (T2) predictive models for EOPE and LOPE.
Receiver operating characteristic (ROC) curves for EOPE (a) and LOPE (d) models across internal validation (validation 1) and external validation (validation 2). The X-axis represents the False Negative Rate; the Y-axis, the True Positive Rate. Violin plots showing correctly and misclassified patients and controls based on the classifier score obtained from the predictive model for EOPE (b) and LOPE (e). The X-axis shows the real obstetric outcome; the Y-axis, the predicted outcome. Bar plot illustrating each cfRNAs contribution to EOPE (c) and LOPE (f) models. The X-axis shows the feature importance scores, which quantify the relative contribution of each cfRNA to the model’s predictions, with higher scores indicating features that play a more significant role in discriminating between outcomes. cfRNAs associated with DR are marked with an asterisk. AUC, area under the curve.

References

    1. Organization WH. 2018 Global Reference List of 100 Core Health Indicators (plus health-related SDGs). (WHO, 2018).
    1. Say, L. et al. Global causes of maternal death: a WHO systematic analysis. Lancet Glob. Health2, e323–e333 (2014). - PubMed
    1. Moreno, I. et al. The human periconceptional maternal-embryonic space in health and disease. Physiol. Rev.103, 1965–2038 (2023). - PubMed
    1. ACOG Practice Bulletin No 202 Summary: gestational hypertension and preeclampsia. Obstet. Gynecol.133, 1 (2019). - PubMed
    1. Hinkle, S. N. et al. Pregnancy complications and long-term mortality in a diverse cohort. Circulation147, 1014–1025 (2023). - PMC - PubMed

LinkOut - more resources