. 2025 Oct 20;16(1):9282.
doi: 10.1038/s41467-025-65180-6.

The microbial metabolite desaminotyrosine protects against graft-versus-host disease via mTORC1 and STING-dependent intestinal regeneration

Affiliations

The microbial metabolite desaminotyrosine protects against graft-versus-host disease via mTORC1 and STING-dependent intestinal regeneration

Sascha Göttert et al. Nat Commun. .

Abstract

Changes in the intestinal microbiome and microbiota-derived metabolites predict clinical outcomes after allogeneic hematopoietic stem cell transplantation (allo-HSCT). Here, we report that desaminotyrosine (DAT), a product of bacterial flavonoid metabolism, correlates with improved overall survival and reduced relapse rates in patients receiving allo-HSCT. In preclinical mouse models, treatment with synthetic DAT prevents graft-versus-host disease by protecting the intestinal barrier and promoting intestinal regeneration and contributes to graft-vs.-leukemia responses. DAT´s beneficial effects on intestinal regeneration remain effective despite broad-spectrum antibiotics-induced dysbiosis, also when administered by fecal microbiota transfer with flavonoid-degrading F. plautii. Mechanistically, DAT promotes mTORC1-dependent activation and proliferation of intestinal stem cells, with concomitant engagement of the innate immune receptor STING required to mitigate metabolic stress and maintain an undifferentiated stem cell state independently of type-I interferon responses. Additionally, DAT can skew T cells towards an effector phenotype to modulate graft-versus-leukemia responses. Our data uncover DAT's dual, tissue- and immune-modulating properties and underscore its potential in precision microbiome-based therapies to improve tissue regeneration and minimize immune-mediated side effects.


Conflict of interest statement

Competing interests: HP: honoraria: Novartis, Gilead, Abbvie, BMS; Pfizer, Servier; Janssen-Cilag travel: Gilead, Janssen-Cilag, Novartis, Abbvie, Novartis; Jazz, Amgen Research: BMS. DW received research support from Novartis and honoraria from Sanofi, Incyte, Behring, Mallickrodt, Neovii and Takeda. F.B.: honoraria: BMS, Janssen, travel: Janssen. M.B-H.: honoraria: Pfizer Pharma GmbH; Sanofi Deutschland GmbH; travel: Novartis Pharma GmbH. S.H. is an employee of and hold equity interest in Roche/Genentech. WH: honoraria: Amgen, Novartis; travel: Janssen-Cilag, Amgen. E.T.O.: honoraria: BeiGene, AstraZeneca, travel: Janssen, Lilly. The content of this manuscript is part of a patent application of S.G., E.T.O. and H.P. All remaining authors declare no competing interest.

Figures
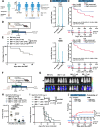
Fig. 1
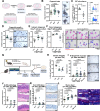
Fig. 1. The microbial metabolite DAT modulates clinical and preclinical GvHD and GvL.
A Study overview. B Stool metabolite concentrations in patients receiving allo-HSCT before (day −7) and after (day +7 to +21) transplantation measured by targeted mass-spectrometry in 50 patients from Munich and Regensburg. Data is presented as violin plot with median as line and quartiles as dotted lines and analyzed by non-parametric paired t-test. C Kaplan Meier plots of patient’s overall survival after allo-HSCT grouped by stool metabolite concentrations of DAT or ICA based on established cut-offs (DAT = 0.005 µmol/g dry feces; ICA = 0.035 µmol/g dry feces) and corresponding patients at risk table. Data was analyzed by Log-rank test. D Experimental design of the murine MHC major mismatch allo-BMT model. E Survival of mice after allo-BMT. Pooled data from 2 independent experiments. Analyzed by Log-rank test. F Experimental design of the GvL model in (GI). G Representative BLI images and H quantification of BLI signal on d13 from two independent experiments. Further time points are shown in Fig. S1B. P-values were calculated using two-way ANOVA with Dunnett’s correction for multiple comparisons or unpaired t-test. I Kaplan Meier plot of survival. Data was analyzed by Log-rank test from 2 independent experiments. J Cumulative incidence of relapse and TRM after 2 years after day +21 in a competing risk analysis, stratified according to DAT high and DAT low. Cumulative incidence functions between groups were tested for equality using Gray’s test. If not depicted otherwise, all data are shown as mean ± SEM. A Created in BioRender. Göttert, S. (2025) https://BioRender.com/lgwl8o0. D Created in BioRender. Göttert, S. (2025) https://BioRender.com/cxfhu92. F Created in BioRender. Göttert, S. (2025) https://BioRender.com/c784lxh.
Fig. 2
Fig. 2. DAT promotes growth and damage protection in murine organoids and in vivo damage models.
A Experimental overview. BD Murine SI organoids were stimulated with 100 µM DAT, 50 µM ICA or carrier. B Representative images and quantification of organoid size after 6 days of metabolite treatment. Data pooled from 10 (ICA) or 20 (Ctrl and DAT) independent experiments. C ISC abundance assessed by flow cytometry (Fig. S2A) after 6 days of metabolite treatment of organoids derived from Lgr5-GFP reporter mice. Representative FACS plots and abundance of Lgr5-GFPhigh ISCs relative to untreated organoids from 3 independent experiments are shown. D Number of established organoids after passaging relative to control (indicated by the dotted line). Data was pooled from 10 independent experiments. E Murine SI organoids were co-cultured with activated splenic T cells in the surrounding media for 4 days without direct interaction and their growth was assessed as described in (D). Data was pooled from 8 independent experiments. F SI organoids were brought in direct contact with allogeneic intraepithelial T cells. After 48 h, cell death was detected by propidium iodide fluorescence and normalized to Hoechst fluorescence. Representative images and PI/Hoechst quantification. Pooled data from 3 (DAT) or 4 (Ctrl and ICA) independent experiments. G in vivo experimental design. H Infiltration of CD11b+Ly6G+Ly6C+ granulocytes of total live CD45+ cells in ileum was assessed by flow cytometry (Fig. S2D) on day 3 after 9 Gy TBI. Pooled data from 3 (n = 5 (Ctrl) or 6 (DAT and ICA)) independent experiments. I Count of recovered small intestinal organoids on day 7 after allo-BMT and representative pictures. Pooled data from 6 experiments (n = 29 (Ctrl), 15 (DAT and ICA) and 14 (BM only)). J Histopathology score and K number of infiltrating T cells in the colon of mice treated as in (Fig. 2G). Pooled data from 3 independent experiments (n = 8 (Ctrl) or 7 (DAT and ICA)). Scale bar indicates 100 µm. L Quantification and representative pictures of the large intestinal mucus layer thickness. Pooled data from 3 independent experiments (n = 15 (Ctrl), 14 (DAT and ICA) or 4 (BM only)). Scale bar indicates 50 µm. P-values were calculated by ordinary one-way ANOVA with Dunnett’s correction for multiple comparisons (B, E, F, J, K, L), Kruskal–Wallis test with Dunn’s correction for multiple comparisons (H, I) or one sample t-test (C, D). All data are shown as mean ± SEM. A Created in BioRender. Göttert, S. (2025) https://BioRender.com/era0sp5. G Created in BioRender. Göttert, S. (2025) https://BioRender.com/wzxx6td.
Fig. 3
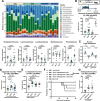
Fig. 3. DAT treatment is effective in SPF but not GF mice and remains effective after antibiotic-induced dysbiosis.
A Mice were treated with metabolites as described in Fig. 2G, stool samples (n = 8) were collected on d0 and analyzed by 16S rRNA sequencing. Relative abundance on family level and comparisons of the top 5 most abundant families is shown. B Experimental layout for treatment of germfree mice and organoid regeneration was assessed as described for Fig. 2I but Rock inhibitor was added to the culture medium. Pooled data from 4 experiments (n = 15 (Ctrl and DAT or 4 (ICA and BM only)). C Small intestinal crypts were isolated from GF BALB/c mice or littermates reconstituted by FMT. Crypts were stimulated directly after initiation of culture and organoid growth was assessed as in Fig. 2D relative to its respective control. Pooled data from 4 independent experiments. D C57BL/6 mice were continuously treated with ampicillin/enrofloxacin added to their drinking water beginning one week before metabolite treatment. Allo-BMT and organoid recovery were performed as in Fig. 2I but in presence of Rock inhibitor. Pooled data from 3 independent experiments (n = 13 (Ctrl and DAT) or 15 (ICA)). E C57BL/6 mice were treated with meropenem per drinking water for 7 days for induction of dysbiosis before metabolite treatment, allo-BMT with 1.5 × 106 allogeneic T cells and large intestinal organoid regeneration was performed as outlined in Fig. S2E. Pooled data from 3 independent experiments (n = 14 (Ctrl and ICA), 13 (DAT) or 8 (noAbx)). F Balb/c mice were treated with meropenem and metabolites as in (E) and underwent allo-BMT. Kaplan–Meier plot of survival. Data was analyzed by Log-rank test. G Mice were treated with ampicillin/enrofloxacin for 5 days beginning on day -14. On day −7 and -5, mice received FMT with cecal content of SPF mice or human or murine F. plautii isolates (DSM 6740 or 26117, respectively) followed by allo-BMT and scoring of SI organoid regeneration. Pooled data from 3 independent experiments (n = 7). P-values were calculated with ordinary one-way ANOVA with Dunnett’s correction for multiple comparisons (A, B, D, E), Kruskal–Wallis test with Dunn’s correction for multiple comparisons (G) or one sample t-test (C). All data are shown as mean ± SEM. B Created in BioRender. Göttert, S. (2025) https://BioRender.com/ulwbqe3.
Fig. 4
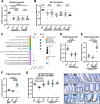
Fig. 4. DAT acts on the intestinal stem cell compartment and requires STING but not IFN-I signaling.
A The growth of SI organoids derived from STINGGT/GT and IFNaR–/– mice was assessed as described in Fig. 2D. Pooled data from 6 (IFNaR–/–) or 7 (STINGGT/GT) independent experiments. P-values were calculated by one sample t-test. B Small intestinal STINGGT/GT organoid size was assessed as in Fig. 2B. Pooled data from 13 independent experiments analyzed by unpaired t-test. C STING-deficient organoids were co-cultured with allogeneic activated T cells as in Fig. 2E. Pooled data from 4 independent experiments analyzed by Kruskal–Wallis test with Dunn’s correction for multiple comparisons. D Organoid recovery was assessed in C57BL/6 WT, STINGGT/GT or IFN-I receptor deficient mice that were treated with metabolites and underwent allo-BMT as in Fig. 2I. Pooled data from 4−7 individual experiments (n = 15 (STINGGT/GT Ctrl and DAT, WT Ctrl and DAT), 17 (STINGGT/GT ICA and WT ICA), 18 (IFNaR–/– DAT), 14 (IFNaR–/– Ctrl), 10 (IFNaR–/– ICA)). P-values were calculated using Kruskal–Wallis test with Dunn’s correction for multiple comparisons for depicted genotypes individually. EH Murine small intestinal organoids generated from WT or STINGGT/GT mice were stimulated with metabolites as before for 4 days and subsequently analyzed by scRNA-seq. Pooled data from 3 independent experiments. E Experimental layout. F Plot of single cells in UMAP space from all experimental conditions, colored by final cell type annotation. G Ordering of the ISC and TA subset of cells (according to SingleR cell type annotation) on a pseudotime trajectory. H Differential cell type abundance analysis of DAT-treated organoids compared to their respective control or between treated WT and GT organoids, based on negative binomial regression. Data shown as log2 fold change regression estimate with associated 95% confidence interval based on the normal distribution. P-values were calculated using Wald test with linear contrasts of negative binomial regression parameter estimates and adjusted for multiple testing using the FDR approach, controlling for an FDR of 10%. Data are shown as mean ± SEM if not stated otherwise. E Created in BioRender. Göttert, S. (2025) https://BioRender.com/v96q785.
Fig. 5
Fig. 5. DAT activated mTORC1 signaling in intestinal stem cells is counter-regulated by STING.
A Murine SI organoid growth was assessed as in Fig. 2D but in presence of the mTOR inhibitor Rapamycin (1 µM) or the MAPK inhibitor U0126 (10 µM). Pooled data from 3 independent experiments was analysed by ordinary one-way ANOVA with Dunnett’s correction for multiple comparisons or unpaired t-test. B Lgr5-GFPhigh ISC abundace were assessed as in Fig. 2C, but in presence of rapamycin, the STING inhibitor H151 or chloroquine. Pooled data from 4 independent experiments. P-values were calculated using one sample t-test or Mann-Whitney U test. C Dotmap of GSEA results of selected pathways/gene sets for ISC and ISC-II cells and different conditions (vs. control, cell types as described in Fig. 4F, G). Dots are colored by the negative log10 of the GSEA q-value (FDR), the sign indicates the direction of the regulation (up positive, down negative). The size of the dots corresponds to the normalized enrichment score (NES). Gene sets/pathways are derived from the Hallmark (H) and Reactome (R) gene set collections of MSigDB. D Murine SI organoid growth was assessed as in Fig. 2D but in presence of the autophagy inhibitor chloroquine (10 µM). Pooled data from 4 independent experiments. E STING deficient SI organoids were stimulated as in Fig. 4A but in presence of the antioxidant agent N-acetyl-cystein (2.5 mM). Pooled data from 4 independent experiments. F Murine SI organoid growth was assessed as in Fig. 2D in ENR media (containing EGF, Noggin and R-spondin) or NR (without EGF). Pooled data from 4 independent experiments. G C57BL/6 WT and STING Goldenticket mice underwent metabolite treatment and allo-BMT as in Fig. 4D. The localization of Lgr5 expression was assessed in large intestinal crypts by in-situ hybridization. Percentage of crypts with Lgr5 expression in the upper crypt (above +4 position) and representative images are shown. Data from 2 independent experiments (n = 5). P-values were generated by ordinary one-way ANOVA with Dunnett’s correction for multiple comparisons (A, D, E, F, G) or unpaired t-test (A). All data are shown as mean ± SEM.
Fig. 6
Fig. 6. DAT treatment is effective in healthy donor and patient-derived human organoids.
A Experimental overview. B Human LI organoids derived from healthy donors were stimulated with metabolites and their growth assessed. Pooled data from 3 different donors in independent experiments. C Human LI and SI organoids derived from patients receiving allo HSCT were stimulated with metabolites as in (A) or in presence of H151. Pooled data from 3 (SI), 7 (LI Ctrl, DAT, ICA) or 6 (LI H151, H151 DAT, H151 ICA) donors in independent experiments. D Size of LI PDO after 6 days of metabolite treatment assessed as total organoid area. Pooled data from 5 independent experiments. E Human organoid/T cell co-culture without direct interaction. To mimic cytokine-mediated toxicity, LI PDO were co-cultured with CD3/28 beads + 30 U/ml IL-2 activated pan-T cells derived from healthy volunteers in the surrounding media for 4 days and their growth assessed as in (A). Counts are shown relative to untreated organoids. Pooled data from 4 different patients in independent experiments. F IFNγ concentration in cell culture supernatants of organoid/T cell co-cultures assessed by cytokine bead array. N = 4 wells from two donors. P-values were calculated by one-sample t-test (B+C), ordinary one-way ANOVA with Dunnett’s correction for multiple comparisons (E+F) or paired one-way ANOVA with Dunnett’s correction for multiple comparisons (D). All data are shown as mean ± SEM. A Created in BioRender. Göttert, S. (2025) https://BioRender.com/6quwbnv.
Fig. 7
Fig. 7. DAT promotes T cell activation in vitro in humans and in vivo in mice.
A Experimental overview. Human pan-T cells were stimulated with human anti-CD3/28 beads, 30 U/ml hIL-2 and indicated concentrations of metabolite for 24 h and analyzed by flow cytometry (Fig. S6A). Abundance of the indicated T cell subpopulations (B+G), protein expression according to mean fluorescence intensity (MFI) normalized to the respective control (C, D+H) or ratio of Tregs to IFNγ+CD4+ or IFNγ+CD8+ T cells (E, F). Pooled data from 10 healthy individuals. Data was analyzed using ordinary one-way ANOVA for paired data with Dunnett’s correction for multiple comparisons. I Experimental in vivo design. J Survival of mice. Ctrl and DAT gavage mice are also shown in Fig. 1E. Data was analyzed by Log-Rank test from 2 independent experiments. K BALB/c mice were orally treated with the metabolites and underwent allo-BMT as depicted in Fig. 1D. On day 7 mice were sacrificed and H-2Kb+ donor T cells were analyzed by flow cytometry (Fig. S7A). Abundance of IFNγ+CD8+ cytotoxic T cells and abundance of regulatory T cells. Pooled data from 3 independent experiments and n = 12 mice. Data was analyzed using ordinary one-way ANOVA with Dunnett’s correction for multiple comparisons. If not depicted otherwise, all data are shown as mean ± SEM. A Created in BioRender. Göttert, S. (2025) https://BioRender.com/wzp97wb. I Created in BioRender. Göttert, S. (2025) https://BioRender.com/utm6phc.
Fig. 8
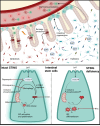
Fig. 8. Graphical summary.
(Upper panel) The microbial metabolite DAT, produced by a healthy microbiome or supplemented as a synthetic metabolite, protects the intestinal epithelium from damage and promotes intestinal regeneration via intestinal stem cells. Systemically, it promotes effector function of T cells and promotes graft-versus-leukemia responses. (Lower panel) In ISCs, DAT promotes proliferation and metabolic activation, but requires STING for metabolic regulation. In the absence of STING, the ability to react to metabolic stress is compromised and ISCs undergo ROS-mediated differentiation. Created in BioRender. Göttert, S. (2025) https://BioRender.com/p48p038.

References

    1. Zeiser, R. & Blazar, B. R. Acute graft-versus-host disease — biologic process, prevention, and therapy. N. Engl. J. Med.377, 2167–2179 (2017). - PMC - PubMed
    1. O’Neill, A. T. & Chakraverty, R. Graft versus leukemia: current status and future perspectives. J. Clin. Oncol.39, 361–372 (2021). - PubMed
    1. Zeiser, R. et al. Ruxolitinib for glucocorticoid-refractory acute graft-versus-host disease. N. Engl. J. Med.382, 1800–1810 (2020). - PubMed
    1. Shouval, R. et al. Outcomes of allogeneic haematopoietic stem cell transplantation from HLA-matched and alternative donors: a European Society for Blood and Marrow Transplantation registry retrospective analysis. Lancet Haematol.6, e573–e584 (2019). - PubMed
    1. Holler, E. et al. Metagenomic analysis of the stool microbiome in patients receiving allogeneic stem cell transplantation: loss of diversity is associated with use of systemic antibiotics and more pronounced in gastrointestinal graft-versus-host disease. Biol. Blood Marrow Transplant.20, 640–645 (2014). - PMC - PubMed

MeSH terms

LinkOut - more resources