. 2025 Oct 20;30(1):121.
doi: 10.1186/s11658-025-00813-8.

Multi-omics analyses integration reveals a novel TRF2-miR-181a-5p-S100A10 regulatory axis in colon cancer

Affiliations

Multi-omics analyses integration reveals a novel TRF2-miR-181a-5p-S100A10 regulatory axis in colon cancer

Roberto Dinami et al. Cell Mol Biol Lett. .

Abstract

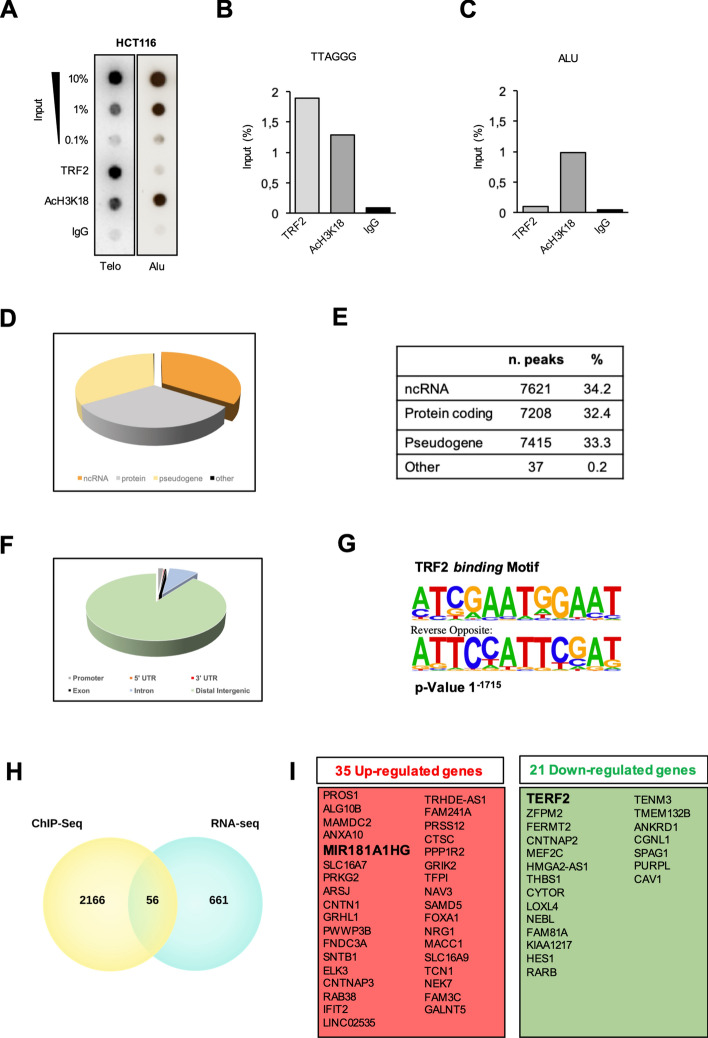
Background: The Telomeric repeat-binding factor 2 (TRF2) binds to TTAGGG repeats located at chromosomes ends and ensures telomere protection together with the other members of shelterin. In addition to its well-known role in telomere maintenance, TRF2 can also bind to interstitial telomeric sequences and regulate the expression of specific genes with a consequent impact on tumor formation and progression. However, a comprehensive analysis of the impact of TRF2 on global gene expression of human cancer cells and of the underlying mechanisms is still lacking.

Methods: The integration of omics technologies (RNA sequencing (RNA-seq), chromatin immunoprecipitation (ChIP-seq), interactomics, and microRNA (miRNA) profiling) was used to deeply investigate the extra-telomeric role of TRF2. Differential gene expression and binding sites of TRF2 were confirmed by qRT-PCR while the interaction of TRF2 with TATA-box binding protein associated factor 15 (TAF15) was validated by immunoprecipitation and proximity ligation assay. Finally, target specificity was assessed by luciferase assay and western blotting while biological effects were investigated by cell migration analysis (unpaired t tests was used to calculate statistical significance).

Results: We found that TRF2 impinges on the expression of 717 genes involved in various cancer-related pathways. Unexpectedly, just a small portion of Differentially Regulated genes are directly bound by TRF2, suggesting the existence of alternative mechanisms of TRF2-mediated gene regulation. In particular, we found that TRF2 binds to various noncoding RNA regions and interacts with many RNA binding proteins, supporting TRF2's involvement in noncoding RNA-mediated mechanisms. Through the intersection of omics-analyses, we provided here experimental evidence of a multilayered mechanism of regulation where TRF2, interacting with TAF15, regulates miR-181A1 host gene and mature miR-181a-5p expression, which in turn targets S100A10, a known plasma membrane protein with oncogenic role.

Conclusions: Our work shows, for the first time, a broad overview on the extra-telomeric role of TRF2 in human cancer, further revealing a new axis through which TRF2 contributes to cancer progression.

Keywords: Colorectal cancer; S100A10; TAF15; TRF2; miR-181a-5p.


Conflict of interest statement

Declarations. Ethics approval and consent to participate: Not applicable. Consent to publication: All authors have read the manuscript and provided their consent for the submission. Competing interests: The authors declare that they have no competing interests.

Figures

Fig. 1
Fig. 1
TRF2 Knockdown alters the transcriptome of HCT116 cells. A RNA-seq analysis performed on HCT116 cells stably infected with shTRF2 or its control (shControl). The DEGs are shown by Volcano plot. Red dots represent significantly upregulated genes (logFC > 0.58 and adjusted p-value < 0.05), blue dots represent significantly downregulated genes (logFC < -0.58 and adjusted p-value < 0.05) and grey dots represent nonsignificant DEGs. B Validation of RNA-seq data by qPCR. Three down-regulated (ARPC5, DIAPH1, CRKII) and up-regulated (SEMAC3, TFPI, JAG1) genes were tested. Samples were normalized to Actin, TRF2 was used as internal control. P-values are indicated. C Bubble plots showing the Gene Ontology analysis of DEGs are represented for Biological Process (BP), Cellular Component (CC) and Molecular Function (MF) at level 5. The x-axis represents the Gene Ratio (calculated as the number of DEGs enriched in each category/set size), while the y-axis represents the enriched categories. The color of the bubbles represents the significance (p-value) while the size reflects the number of DEGs enriched in each category. D Pathways enrichment analysis of DEGs found in RNA-seq is shown with bubble plots from different database (KEGG, REACTOME, WIKI). The x-axis represents the Gene Ratio while the y-axis displays the enriched pathway
Fig. 2
Fig. 2
Genome-wide analysis of TRF2 binding sites in colon cancer cells. A Telomeric ChIP performed in HCT116 cells using the indicated antibodies. Dot-blots were hybridized with a labelled Telo repeat probe and an Alu probe. B Quantification of the telomeric signal in (A) expressed as probe/input. C Quantification of the Alu signal in (A) expressed as probe/input. D, E ChIP-seq analysis by using TRF2 antibody. The distribution of identified peaks across different categories (noncoding RNA (ncRNA), protein-coding genes, pseudogenes and others) is presented, along with the corresponding number and percentage of peaks in each category. F The genomic distribution of TRF2 binding sites were categorized (promoter, 5′UTR, 3′UTR, Exon, Intron and distal intergenic) on the basis of their positions relative to gene loci. G MEME and MAST were used to identify the motif for TRF2 binding sites after sequencing (p-value 1−1715). H The overlap between ChIP-seq and RNA-seq data is shown by a Venn diagram. The number of genes annotated with ChIP-seq peaks in proximity of gene loci, the number of DEGs and overlapping genes are reported. I Genes identified by integration analysis in (H). The 56 genes, directly bound by TRF2, divided in up- and down-regulated genes are indicated
Fig. 3
Fig. 3
TRF2 modulation regulates miR-181A1HG expression in colon cancer cells. A ChIP-seq profile for miR-181A1HG from HCT116 cells visualized using the IGV Browser. B Histogram shows validation of the TRF2 peak in the miR-181AHG region by chromatin immunoprecipitation. C western blotting for TRF2 expression in stably TRF2-depleted HCT116 cells (shTRF2#1, shTRF2#2) compared with its control (shControl). Representative images of TRF2 expression are shown. Actin was used as loading control. D, E Histograms show miR-181A1HG (D) and miR-181a-5p (E) expression analysis by qPCR. Samples were normalized against Actin (D) or RNU44 (E). F Analysis of TRF2 expression in HT29 cells stably over-expressing TRF2 (pTRF2) compared with control (pBabe). A representative immunoblot is shown. G, H miR-181AHG (G) and miR-181a-5p (H) expression were analyzed by qPCR. For B, D–E and G–H, data are the mean ± SD of three independent experiments. Student’s t-test was used to calculate P-values
Fig. 4
Fig. 4
Analysis of the TRF2 interactome in colon cancer cells. A Cytoscape interaction network of TRF2 members identified by nano-LC–MS/MS in the TRF2 IP. Node size is related to the number of proteins identified by MS enriched in the protein set. Colour intensity is related to the P-value of the enrichment while edge thickness is related to StringApp interaction confidence scores. Validation of TRF2-TAF15 interaction by IP experiment. Nuclear extracts obtained from HCT116 were incubated with TRF2 (B) or TAF15 (C) antibody. IgG antibody was used as negative control. The amount of immunoprecipitated TAF15 (B) or TRF2 (C) was detected by WB using anti-TAF15 and anti-TRF2 antibodies (S.E. short exposure; L.E. long exposure). D TRF2-TAF15 Proximity Ligation Assay (PLA) in HCT116 cells. Red signals are generated where the two proteins are in close proximity. For negative controls, TRF2, or TAF15 antibody alone were used. Left panel. Representative images (63X magnification). Right panel. Number of TRF2-TAF15 PLA spots per nucleus (N = 60 cells). Red bars indicate mean. E Co-immunoprecipitation of TAF15-TRF2 after removal of nucleic acids with Benzonase. The amount of TRF2 with or without benzonase was evaluated by western blot analysis using anti-TAF15 and anti-TRF2 antibodies (S.E. short exposure; L.E. long exposure). IgG was used as negative control. F RNA immunoprecipitation (RIP) assay performed in HCT116 cells by using TAF15 antibody. IgG and magnetic beads were used as negative controls. miR-181A1HG expression was analyzed by qPCR. G Analysis of miR-181a-5p expression by qPCR in HCT116 knocked down for TRF2 (shTRF2) or TAF15 (siTAF15).The relative controls are indicated in the figure. For (F, G), data are shown as mean ± SD. Three independent experiments were performed. P-values are determined by Student’s t test
Fig. 5
Fig. 5
miR-181a-5p targets S100A10 5′UTR. A Venn diagram of the intersection between TRF2 down-regulated genes (log2FC < − 1.0) and putative targets of miR-181a-5p analysed by miRWalk 3.0 (3′UTR and 5′UTR with score > 8.0). B Analysis of S100A10 mRNA by qPCR in HCT116 cell stably depleted for TRF2 and its relative control. C Analysis of S100A10 mRNA by qPCR after 72 h of transfection with miR-181a-5p or their controls (miR-Control, miR-181a-5p inhibitor). D Representative images of S100A10 protein levels in HCT116 cells 72 h post-transfection was evaluated by western blot analysis using anti-S100A10 antibody (S.E short exposure, L.E long exposure). Synthetic miRNAs are indicated. Actin was used as loading control. E, F Luciferase reporter assay after transfection of indicated mimic miRNAs in combination with the wild type (E) or mutant 5′UTR of S100A10 construct (F). Pairing model of miR-181a-5p and 5′UTR-S100A10 wild type (E) or mutant (F) is shown (Upper panels). G Expression of miR-181a-5p in CRC patients with High and Low TRF2/S100A10 expression (left panel). Representative images from IHC analysis performed in patients with high or low TRF2/S100A10 expression are shown (right panel). Mann–Whitney test was used to calculate P values
Fig. 6
Fig. 6
miR-181a-5p inhibits cancer cell migration and invasion by targeting S100A10. A Migration assay in HCT116 cells transiently transfected with miR-181a-5p and its relative controls. B Migration assay in HCT116 cells depleted for TRF2 (shTRF2) after transfection with the miR-181a-5p or miR-181a-5p inhibitor. The controls (shControl and miR-Control) are indicated. C Migration of HCT116 cells silenced for TRF2 (shTRF2) and transfected with siS100A10 were analysed. The controls (shControl and siControl) are indicated. D Cell area measurement in TRF2-depleted (shTRF2) cells after transfection with miR-181a-5p or miR-181a-5p inhibitor. The controls (shControl and miR-Control) are indicated. Phalloidin (Green) and DAPI (Blue) label actin cytoskeleton and nuclei, respectively. HCT116 cells were fixed 24 h after seeding and acquired by confocal microscopy. N number of analyzed cells. Mann–Whitney test was used to calculate P values. E Invasion assay in TRF2-depleted (shTRF2) cells after transfection with siS100A10, miR-181a-5p or miR-181a-5p inhibitor. The controls (shControl and siControl) are indicated. For A,B,C, and E, cells were fixed after 48 h and acquired by microscopy (20 × Magnification). Each dot represents one independent experiment. Student’s t test was used to calculate P-values

References

    1. de Lange T. Shelterin-mediated telomere protection. Annu Rev Genet. 2018;52:223–47. 10.1146/annurev-genet-032918-021921. - PubMed
    1. Broccoli D, Smogorzewska A, Chong L, de Lange T. Human telomeres contain two distinct Myb-related proteins, TRF1 and TRF2. Nat Genet. 1997. 10.1038/ng1097-231. - PubMed
    1. Bilaud T, Brun C, Ancelin K, Koering CE, Laroche T, Gilson E. Telomeric localization of TRF2, a novel human telobox protein. Nat Genet. 1997. 10.1038/ng1097-236. - PubMed
    1. Celli GB, de Lange T. DNA processing is not required for ATM-mediated telomere damage response after TRF2 deletion. Nat Cell Biol. 2005;7:712–8. 10.1038/ncb1275. - PubMed
    1. Denchi EL, De Lange T. Protection of telomeres through independent control of ATM and ATR by TRF2 and POT1. Nature. 2007;448:1068–71. 10.1038/nature06065. - PubMed

MeSH terms