. 2025 Oct 20;32(1):92.
doi: 10.1186/s12929-025-01187-x.

Dimethyl fumarate reprograms cervical cancer cells to enhance antitumor immunity by activating mtDNA-cGAS-STING pathway

Affiliations

Dimethyl fumarate reprograms cervical cancer cells to enhance antitumor immunity by activating mtDNA-cGAS-STING pathway

Han Jiang et al. J Biomed Sci. .

Abstract

Background: Cervical cancer (CC) remains a significant global health challenge for women, especially in advanced stages where effective treatments are limited. Current immunotherapies, including PD-1/PD-L1 blockades and adoptive T cell therapies, show limited response rates and durability. Dimethyl fumarate (DMF), an FDA-approved drug for autoimmune diseases, has demonstrated direct antitumor activity in several cancers. However, its influence on anti-tumor immunity and its function in CC remain poorly understood. This study aims to investigate the therapeutic potential of DMF in CC models and elucidate its underlying mechanisms of action.

Methods: CC cell lines and mouse models were treated with DMF. Transcriptomics profiling of cervical cancer cells following DMF treatment were analyzed by RNA-seq and bioinformatic methods. Mitochondrial DNA (mtDNA) release, and cGAS-STING activation were assessed via qPCR, immunofluorescence, immunoblotting and ELISA. CD8+ T cell recruitment was analyzed by flow cytometry. Combinatorial therapies (DMF + anti-PD-1/TILs) were tested in syngeneic or patient-derived xenografts (PDX) models.

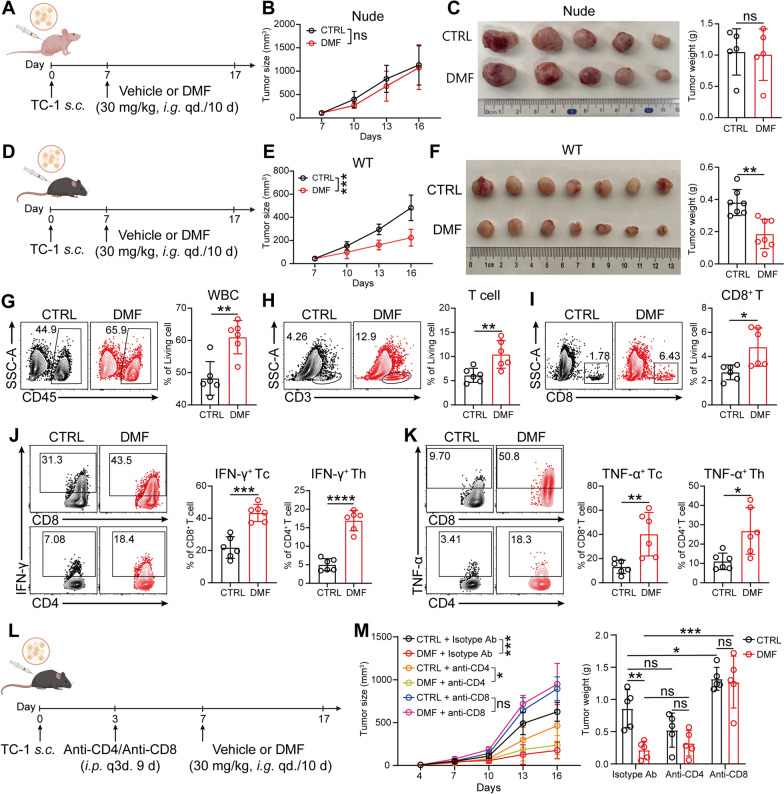
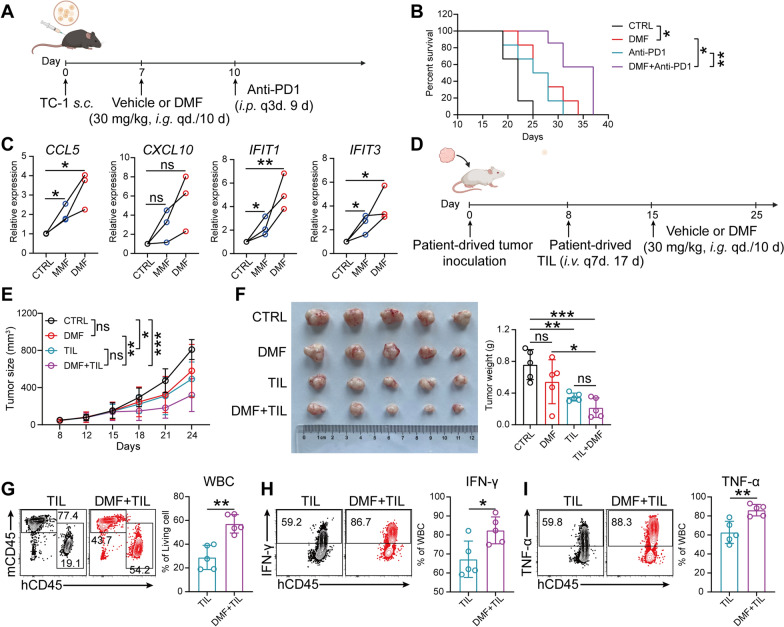
Results: DMF treatment induces mitochondrial dysfunction in tumor cells, resulting in the release of mtDNA into the cytosol. The cytosolic mtDNA in turn activates the cGAS-STING-TBK1 pathway and type I interferon response, leading to the secretion of CCL5 and CXCL10, thereby enhancing CD8⁺ T cell infiltration. Additionally, DMF exhibits synergistic effect with PD-1 blockade in murine CC model, and can enhance the therapeutic efficacy of adoptively transferred T cells toward CC in patient-derived xenografts model.

Conclusion: This work elucidated that DMF reprograms CC cells to activate the mtDNA-cGAS-STING pathway, fostering a chemokine-rich microenvironment that recruits CD8+ T cells. The synergistic effect of DMF and PD-1 blockade or TIL therapy underscores its potential as an immunostimulatory adjuvant. These findings suggest that DMF holds promise as a novel immunotherapeutic strategy for improving clinical outcomes in CC.

Keywords: CCL5; CD8+ T; CXCL10; Cervical cancer; Dimethyl fumarate; Immunotherapy.


Conflict of interest statement

Declarations. Ethics approval and consent to participate: This study was reviewed and approved by the Institutional Animal Care and Use Committee (IACUC) of Huazhong University of Science and Technology. ([2024] IACUC Number:4334). Consent for publication: Not applicable. Competing interests: The authors have declared that no competing interests exist.

Figures

Fig. 1
Fig. 1
DMF enhances anti-CC immunity through CD8+ T Cell-mediated mechanisms. A, Schematic of experimental design for B and C. i.g., intragastric administration; s.c., subcutaneous. Created with BioRender.com. B, Tumor growth curve in TC-1 tumor-bearing nude mice following i.g. treatment with DMF. (n = 5 mice). C, Image of tumors (left) and weight measurements (right) in nude mice treated with or without 30 mg per kg body weight of DMF at day 17. D, Schematic of experimental design for E and F. Created with BioRender.com. E, Tumor growth curve in TC-1 tumor-bearing immunocompetent mice following i.g. treatment with DMF. (n = 7 mice). F, Image of tumors (left) and weight measurements (right) in immunocompetent mice treated with or without 30 mg per kg body weight of DMF at day 17. GK, As in D, percentage of infiltrating white blood cells (WBC) (G); total T cells (H); CD8⁺ T cells (I); the proportions of IFN-γ⁺ (J) and TNF-α⁺ (K) cells among CD8⁺ T cells and CD4⁺ T cells in tumor of immunocompetent mice were analyzed by flow cytometry. (n = 6 mice). L, TC-1 tumor-bearing mouse treated with or without DMF and intraperitoneal (i.p.) injected with 100 μg of CD4/CD8-depleting antibodies on day 3, 6, 9, and 12 post tumor inoculation. Created with BioRender.com. M, Tumor growth curves (left) and tumor weights (right) were measured. (n = 5 mice). Data are the mean ± SD. P values were calculated using unpaired two-tailed Student’s t test (B, C, EK), two-way ANOVA for Tukey’s multiple comparisons test (M). *P < 0.05, **P < 0.01, ***P < 0.001, ****P < 0.0001, and ns indicating no significant difference
Fig. 2
Fig. 2
DMF enhances CD8+ T cell-mediated anti-CC immunity by improving the immunogenicity of tumor cells. A, Schematic of experimental design for B and C. Created with BioRender.com. B, Tumor growth curves. C, Image of tumors (left) and weight measurements (right) in immunodeficient mice. (n = 6 mice). D, Schematic of experimental design for E and F. Created with BioRender.com. E, Tumor growth curves. F, Image of tumors (left) and weight measurements (right) in immunocompetent mice. (n = 6 mice). GL, As in D, percentage of WBC (G); CD8⁺ T cells (H); IFN-γ⁺CD8⁺ T cells (I); TNF-α⁺CD8⁺ T cells (J); GzmB⁺CD8⁺ T cells (K) and Perforin⁺CD8⁺ T cells (L) in immunocompetent mice were analyzed by flow cytometry. (n = 6 mice). M, Schematic of experimental design for N. Created with BioRender.com. N, Tumor growth curves (left) and mouse survival curves (right) were recorded. (n = 7 mice). Data are the mean ± SD. P values were calculated using one-way ANOVA for Dunnett’s multiple comparisons test (C, F, G-L), two-way ANOVA for Tukey’s multiple comparisons test (B, E, N left) and log-rank test for survival analysis (N right). *P < 0.05, **P < 0.01, ***P < 0.001, ****P < 0.0001, and ns indicating no significant difference
Fig. 3
Fig. 3
DMF enhances CD8+ T cell infiltration through inducing tumor cells to secrete CCL5 and CXCL10. AC, RNA-seq results of TC-1 cells treated with or without 50 µM DMF for 24 h. A, Volcano plot of differentially expressed genes (DEGs), type I interferon response relative genes were annotated. B, GSEA plot showing the interferon alpha response pathway. C, GSEA plot showing the interferon beta response pathway. D, Transcriptional levels of Cxcl10, Ccl5, Ifit1, and Ifit3 in TC-1 cells treated with or without 100 μM MMF or 50 μM DMF for 24 h, analyzed by qRT-PCR. E, Concentrations of CXCL10 and CCL5 in the supernatant of TC-1 cells after 24 h of treatment with 100 μM MMF or 50 μM DMF, quantified by ELISA. F, Transcriptional levels of CXCL10 and CCL5 in SiHa cells treated with or without 100 μM MMF or 50 μM DMF for 24 h, analyzed by qRT-PCR. G and H, After 10 days of treatment with DMF by gavage, tumors were harvested from immunocompetent mice. (as in Fig. 1D). G, Transcriptional levels of Cxcl10 and Ccl5 in CD45⁻ cells derived from tumor tissue, analyzed by qRT-PCR. (n = 6 mice). H, Concentrations of CXCL10 and CCL5 in the tumor interstitial fluid, quantified by ELISA. (n = 6 mice). I, Pearson correlation analyses of CD8 mRNA expression with CCL5 and CXCL10 in TCGA-CESC tumor samples. Analysed with http://gepia2.cancer-pku.cn/. J, Schematic of experimental design for the Transwell system (left) created with BioRender.com and the number of migrated CD8⁺ T cells in the lower chamber was counted after 6 h. K, Schematic of experimental design for L and M. Created with BioRender.com. L, Tumor growth curves. M, percentage of CD8⁺ T cells were analyzed by flow cytometry. (n = 5 mice). Data are the mean ± SD. P values were calculated using unpaired two-tailed Student’s t test (G and H), one-way ANOVA for Dunnett’s multiple comparisons test (DF), two-way ANOVA for Tukey’s multiple comparisons test (J, L and M). *P < 0.05, **P < 0.01, ***P < 0.001, ****P < 0.0001, and ns indicating no significant difference
Fig. 4
Fig. 4
cGAS-STING-TBK1 pathway mediates the DMF-induced anti-tumor immune response. A and B, Immunoblots of IRF3, p-IRF3, TBK1, p-TBK1 (A), and relative abundance of cGAMP (B) in TC-1 cells treated with 100 μM MMF or 50 μM DMF for 24 h. C and D, Immunoblots of IRF3, p-IRF3, TBK1, p-TBK1(C), and relative abundance of cGAMP (D) in SiHa cells treated with 100 μM MMF or 50 μM DMF for 24 h. E, Immunoblots of STING in TC-1 cells, comparing Vector and Sting knockout (KO) cells. F and G, CCL5 and CXCL10 were quantified by qRT-PCR (F) and ELISA (G) respectively, in vector or Sting KO TC-1 cells treated with 100 μM MMF or 50 μM DMF for 24 h. HO, As in Fig. 1A, a total of 1 × 105 vector or Sting−/− TC-1 cells were subcutaneously implanted into mice. H, Schematic of experimental design created with BioRender.com. I, Tumor growth curves. J, Image of tumors (left) and weight measurements (right) at day 17. K–O, Percentage of infiltrating CD8⁺ T cell populations, including total CD8⁺ T cells (K), IFN-γ⁺CD8⁺ T cells (L), TNF-α⁺CD8⁺ T cells (M), GzmB⁺CD8⁺ T cells (N), and Perforin⁺CD8⁺ T cells (O) in tumor were analyzed by flow cytometry. (n = 6 mice). Data are presented as the mean ± SD. P values were calculated using one-way ANOVA for Dunnett’s multiple comparisons test (A-D), two-way ANOVA for Tukey’s multiple comparisons test (F and G, I-O). *P < 0.05, **P < 0.01, ***P < 0.001, ****P < 0.0001, and ns indicating no significant difference
Fig. 5
Fig. 5
DMF/MMF treatment induces tumor cells to release mtDNA into the cytoplasm. A, GSEA plot of the oxidative stress response in TC-1 cells treated with or without 50 μM DMF. BD, CellROX levels (B), MitoSOX levels (C) and mitochondrial membrane potential (D) were measured in TC-1 and SiHa cells treated with 100 μM MMF or 50 μM DMF for 12 h. E, Electron microscopy of TC-1 cells treated with 100 μM MMF or 50 μM DMF for 24 h. F, GSEA plot of the Cytosolic sensors of pathogen associated DNA pathway in TC-1 cells treated with or without 50 μM DMF. G–H, Immunofluorescence image of tumor cells treated with 100 μM MMF or 50 μM DMF for 24 h, (G) showing TC-1 cells, (H) showing SiHa cells. DNA, red; TOM20, green; scale bar = 5 μm. I, Quantitative analysis of extramitochondrial DNA in the cytosol in Fig. G and H. (n = 13–15 cells). J, Relative expressions of nuclear (nuc) and mitochondrial (mt) DNA outside the mitochondria in the cytoplasm was detected by qRT-PCR. Data are presented as the mean ± SD. P values were calculated using one-way ANOVA for Dunnett’s multiple comparisons test (BD, I), two-way ANOVA for Tukey’s multiple comparisons test (J). *P < 0.05, **P < 0.01, ***P < 0.001, ****P < 0.0001, and ns indicating no significant difference
Fig. 6
Fig. 6
Cytoplasmic mtDNA is required for DMF/MMF-induced activation of the cGAS-STING pathway and antitumor response. A and B, CCL5 and CXCL10 were quantified by qRT-PCR (A) and ELISA (B) respectively, in TC-1 and TC-1ρ0 cells treated with 100 μM MMF or 50 μM DMF for 24 h. C and D, Immunoblots of IRF3, p-IRF3, TBK1, p-TBK1 (C) and relative abundance of cGAMP levels (D) in TC-1 and TC-1ρ0 cells treated with 100 μM MMF or 50 μM DMF for 24 h. E and F, Immunoblots of IRF3, p-IRF3, TBK1, p-TBK1 (E) and relative abundance of cGAMP levels (F) in SiHa and SiHaρ0 cells treated with 100 μM MMF or 50 μM DMF for 24 h. G, Schematic of experimental design for H and I. Created with BioRender.com. H, Tumor growth curves. I, Image of tumors (left) and weight measurements (right) at day 15. (n = 5–6). Data are presented as the mean ± SD. P values were calculated using two-way ANOVA for Tukey’s multiple comparisons test (A-F, H and I). *P < 0.05, **P < 0.01, ***P < 0.001, ****P < 0.0001, and ns indicating no significant difference
Fig. 7
Fig. 7
DMF improves the therapeutic efficacy of immunotherapy with PD-1 blockade and TILs. A, TC-1 tumor bearing mouse gavaged with or without DMF and treated with 100 μg of anti-PD1 antibodies on day 10, 13 and 16 post tumor inoculation. (n = 6 mice). Created with BioRender.com. B, Mouse survival curves were recorded. C, Transcriptional levels of CXCL10, CCL5, IFIT1, and IFIT3 in PDXOs from cervical cancer patients treated with 100 μM MMF or 50 μM DMF, analyzed by qRT-PCR. (n = 3 patients). D, Schematic of experimental design for EF, i.v. intravenous injections. i.p. intraperitoneal injections. Created with BioRender.com. E, Tumor growth curve. F. Image of tumors (left) and weight measurements (right) at day 25. The proportion of patient-derived WBCs (G), IFN-γ⁺ WBC cells (H) and TNF-α⁺ WBC cells (I) in PDX were analyzed. (n = 5 mice). Data are presented as the mean ± SD. P values were calculated using unpaired two-tailed Student’s t test (GI), one-way ANOVA for Dunnett’s multiple comparisons test (C), two-way ANOVA for Tukey’s multiple comparisons test (E and F), log-rank test for survival analysis, and corrected by Bonferroni methods (B). *P < 0.05, **P < 0.01, ***P < 0.001, ****P < 0.0001, and ns indicating no significant difference

References

    1. Siegel RL, Kratzer TB, Giaquinto AN, Sung H, Jemal A. Cancer statistics, 2025. CA Cancer J Clin. 2025;75(1):10–45. - PMC - PubMed
    1. Tewari KS. Cervical cancer. N Engl J Med. 2025;392(1):56–71. - PubMed
    1. Bray F, Laversanne M, Sung H, Ferlay J, Siegel RL, Soerjomataram I, et al. Global cancer statistics 2022: GLOBOCAN estimates of incidence and mortality worldwide for 36 cancers in 185 countries. CA Cancer J Clin. 2024;74(3):229–63. - PubMed
    1. Pfaendler KS, Tewari KS. Changing paradigms in the systemic treatment of advanced cervical cancer. Am J Obstet Gynecol. 2016;214(1):22–30. - PMC - PubMed
    1. How JA, Patel A, Jazaeri AA. Immuno-oncology for gynecologic malignancies. Adv Exp Med Biol. 2021;1342:193–232. - PubMed

MeSH terms