. 2025 Oct 21.
doi: 10.1039/d5lc00474h. Online ahead of print.

Endothelial-smooth muscle microgauges for modeling pulmonary arterial vasoregulation

Affiliations

Endothelial-smooth muscle microgauges for modeling pulmonary arterial vasoregulation

Aanya Sawhney et al. Lab Chip. .

Abstract

Pulmonary arterial hypertension (PAH) is a devastating disease for which there is no cure. The pathogenesis of PAH involves endothelial dysfunction and dysregulation of vascular tone, resulting in progressively narrowing pulmonary arteries that increase hemodynamic resistance and blood pressure. The development of effective therapeutics for PAH is hindered by limitations to animal models and a lack of humanized in vitro systems that recapitulate endothelial-dependent regulation of smooth muscle cell contractility. Here, we microfabricated pulmonary artery smooth muscle microgauges (PA-SMUGs) that enable quantification of contractile forces generated by human pulmonary arterial smooth muscle cells (PASMCs) within microtissues that contain a functional monolayer of pulmonary arterial endothelial cells (PAECs). PA-SMUGs demonstrate PAEC-dependent vasorelaxation and respond to treprostinil, a clinically approved PAH therapy. This platform, which establishes a high-throughput method for quantifying EC-dependent vasorelaxation, will facilitate mechanistic studies into the role of PAEC-PASMC crosstalk in PAH pathogenesis and enable screening for novel therapeutics to improve PAH outcomes and hypertensive diseases more broadly.


Conflict of interest statement

W. J. P. receives research support from United Therapeutics.

Figures
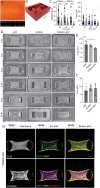
Fig. 1
Fig. 1. Characterization of pulmonary arterial smooth muscle microtissue formation, contractile force, area, and organization. (A) Image of SMUG0.52 microfabricated silicon master mold (diameter of stamp is 25 mm) with inset micrograph of 2 × 3 array of microtissues seeded with HDFs after contraction (scale bar 0.9 mm). (B) 3D reconstruction of confocal images of Nile red-labeled PDMS microwell prior to cell seeding. (C) Post deflection and forces computed with post bending stiffness for microtissues seeded with 5 × 10⁵ HDFs mL−1. (D) Representative phase-contrast images of microtissue formation time course of HDF, PASMC, and PASMC : HDF (4 : 1). All conditions seeded at 5 × 10⁵ cells per mL (scale bar 0.24 mm). Quantification of (E) projected area of microtissues 24 h after seeding and (F) contractile forces generated by microtissues. (G) Confocal maximum intensity projections of PASMC : HDF (4 : 1) microtissues projected for the whole tissue, top half, and bottom half as indicated by schematic (scale bar 100 μm). All plots are mean ± S.E.M. with each datapoint representing an individual microtissue, statistics determined by one-way ANOVA, n ≥ 4 microtissues, *p < 0.05, ***p < 0.001.
Fig. 2
Fig. 2. Characterization of donor-derived pulmonary arterial smooth muscle microtissue force and area. (A) Representative phase-contrast images of 24 h endpoint control and donor PASMC : HDF (4 : 1) microtissues, seeded at 5 × 10⁵ cells per mL slurry (scale bar 0.24 mm). (B) Quantification of control and donor PASMC : HDF (4 : 1) microtissue force and (C) projected area 24 h after seeding. (D) Representative images of microtissues from donors with forces or areas that differ significantly from baseline 24 h after seeding (scale bar 75 μm). All plots mean ± S.E.M., *p < 0.05, **p < 0.01, ***p < 0.001 vs. control as determined by one-way ANOVA, n = 10 microtissues.
Fig. 3
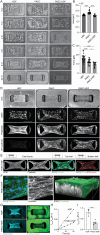
Fig. 3. Characterization of pulmonary arterial endothelial microtissue formation, force, area, and organization. (A) Representative phase-contrast images of microtissue formation time course of HDF, PAEC, and PAEC : HDF (4 : 1) seeded at 5 × 10⁵ cells per mL slurry (scale bar 0.24 mm). Quantification of HDF, PAEC, and PAEC : HDF (4 : 1) microtissue (B) projected area and (C) contractile force at 24 h after seeding. (D) Confocal maximum intensity projections of HDF, PAEC, and PAEC : HDF (4 : 1) microtissues (scale bar 0.24 mm). (E) Confocal maximum intensity projections for whole microtissues, top half, and bottom half as indicated by schematic of PAEC : HDF microtissues (scale bar 200 μm). (F) Magnified confocal maximum intensity projection of top slices of microtissue area indicated in (E) and 3D reconstruction showing the spatial organization of VE-cadherin-positive monolayer at the surface of the tissue (scale bar 15 μm). (G) Confocal slices of HDF versus PAEC : HDF (4 : 1) microtissues 1 min after adding 20 MDa dextran. Reflectance images used to find the median slice of each microtissue (scale bar 100 μm). (H) Fluorescence intensity of dextran in the center of the microtissue normalized by intensity in the well outside the tissue as a function of time. (I) Normalized fluorescent intensity measured in individual tissues 3 min after adding 20 MDa dextran. *p < 0.05, **p < 0.01, ***p < 0.001, ***p < 0.0001 as determined by one-way ANOVA, with n ≥ 3 microtissues. All plots mean ± S.E.M. and each data point indicating an individual microtissue.
Fig. 4
Fig. 4. Dynamic vasorelaxation of PA-SMUGs in response to drug treatment and hemodynamic flow. (A) Maximum intensity confocal projections for top half and bottom half of PAEC : PASMC : HDF (5 : 4 : 1) microtissues (PA-SMUGs) as indicated in schematic. (B) Baseline contractile force for duo-culture and PA-SMUGs 24 h after seeding. (C) Representative phase-contrast images of PASMC : HDF (4 : 1) microtissues at baseline and after sequential acetylcholine (Ach), treprostinil (Trp), and cytochalasin-D (Cyto-D) treatments. (D) Dynamic force measurements of PASMC : HDF (4 : 1) microtissues throughout drug treatments at timepoints indicated on graph. (E) Changes in contractile force of PASMC : HDF (4 : 1) microtissues after 30 min drug treatments normalized to baseline contraction values prior to drug treatment (negative values indicate microtissue relaxation). (F) Representative phase-contrast images of PAEC : HDF (4 : 1) microtissues at baseline and after drug treatments as in (C). (G) Dynamic force of PAEC : HDF (4 : 1) microtissues in response to drug treatment. (H) Changes in contractile force of PAEC : HDF (4 : 1) microtissues after 30 min drug treatments. (I) Representative images of PAEC : PASMC : HDF (5 : 4 : 1) microtissues after sequential drug treatment as in (C) (scale bar 0.24 mm). (J) Dynamic force of PAEC : PASMC : HDF (5 : 4 : 1) microtissues throughout drug treatments at indicated timepoints. (K) Changes in contractile force of PAEC : PASMC : HDF (5 : 4 : 1) microtissues after 30 min drug treatments. (L) Schematic representation of flow chamber setup. (M) Representative phase contrast images of PA-SMUGs before and after application of flow to induce 8 dyne cm−2 shear stress at the microtissue surface for 5 min. (N) Contractile force of PA-SMUGs and control microtissues with seeded with HDF or PAEC : HDF. Images were acquired prior to removing PA-SMUGs from dish used for seeding (pre-cut), after device assembly and prior to application of flow (pre-flow), and after 5 min of flow with and without L-NAME for the triculture condition (for ****p < 0.001 as determined by t-test). For all images, scale bar 0.24 mm. For static experiments, all plots are mean ± S.E.M. from n ≥ 36 microtissues, with individual datapoints referring to individual microtissues. *p < 0.05, **p < 0.001, ****p < 0.0001 as determined by one-way ANOVA.

References

    1. Tykocki N. R. Boerman E. M. Jackson W. F. Compr. Physiol. 2017;7:485–581. - PMC - PubMed
    1. Bochaton-Piallat M. L. Back M. Cardiovasc. Res. 2018;114:477–480. - PubMed
    1. Brozovich F. V. Nicholson C. J. Degen C. V. Gao Y. Z. Aggarwal M. Morgan K. G. Pharmacol. Rev. 2016;68:476–532. - PMC - PubMed
    1. Barbour J. R. Spinale F. G. Ikonomidis J. S. J. Surg. Res. 2007;139:292–307. - PubMed
    1. Zhang H. Li M. Hu C.-J. Stenmark K. R. Cells. 2024;13(11):914. - PMC - PubMed

LinkOut - more resources