. 2025 Oct 21;23(10):e3003446.
doi: 10.1371/journal.pbio.3003446. eCollection 2025 Oct.

Forty new genomes shed light on sexual reproduction and the origin of tetraploidy in Microsporidia

Affiliations

Forty new genomes shed light on sexual reproduction and the origin of tetraploidy in Microsporidia

Amjad Khalaf et al. PLoS Biol. .

Abstract

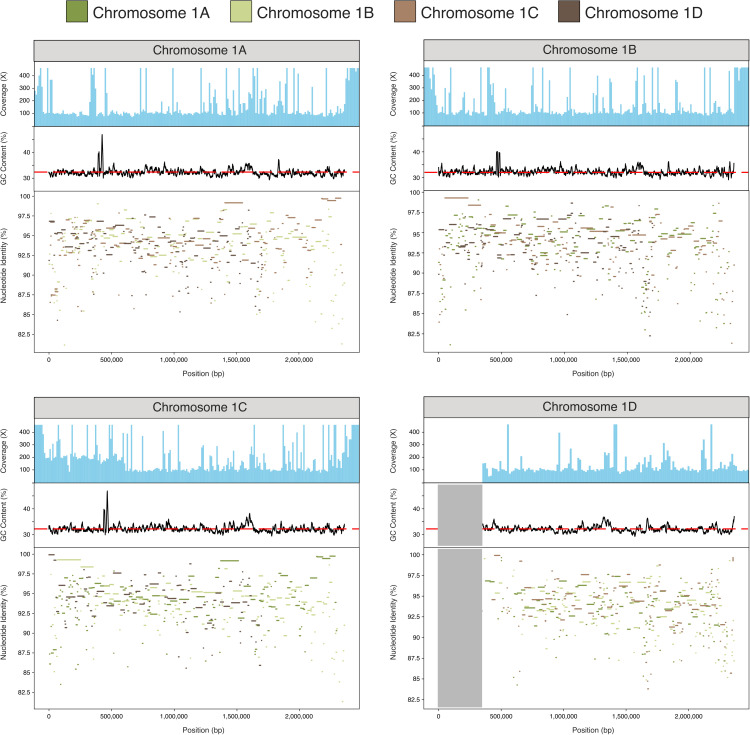
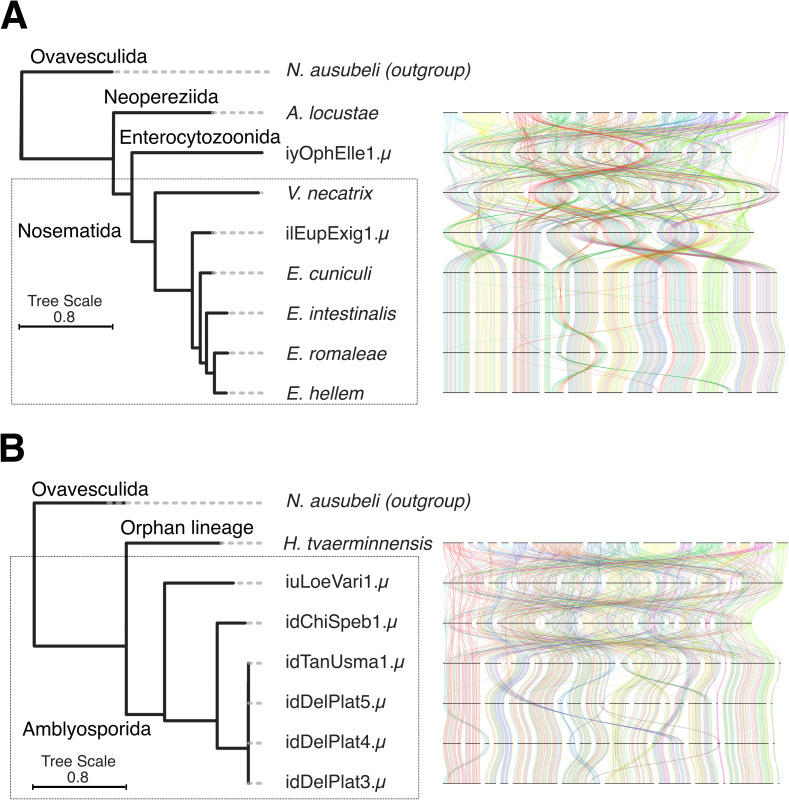
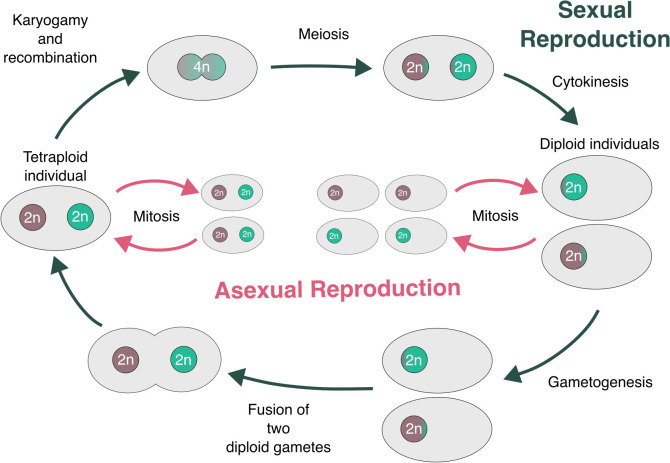
Microsporidia are single-celled, obligately intracellular parasites with growing public health, agricultural, and economic importance. Despite this, Microsporidia remain relatively enigmatic, with many aspects of their biology and evolution unexplored. Key questions include whether Microsporidia undergo sexual reproduction, and the nature of the relationship between tetraploid and diploid lineages. While few high-quality microsporidian genomes currently exist to help answer such questions, large-scale biodiversity genomics initiatives, such as the Darwin Tree of Life project, can generate high-quality genome assemblies for microsporidian parasites when sequencing infected host species. Here, we present 40 new microsporidian genome assemblies from infected arthropod hosts that were sequenced to create reference genomes. Out of the 40, 32 are complete genomes, eight of which are chromosome-level, and eight are partial microsporidian genomes. We characterized 14 of these as polyploid and five as diploid. We found that tetraploid genome haplotypes are consistent with autopolyploidy, in that they coalesce more recently than species, and that they likely recombine. Within some genomes, we found large-scale rearrangements between the homeologous genomes. We also observed a high rate of rearrangement between genomes from different microsporidian groups, and a striking tolerance for segmental duplications. Analysis of chromatin conformation capture (Hi-C) data indicated that tetraploid genomes are likely organized into two diploid units, similar to dikaryotic cells in fungi, with evidence of recombination within and between units. Together, our results provide evidence for the existence of a sexual cycle in Microsporidia, and suggest a model for the microsporidian lifecycle that mirrors fungal reproduction.


Conflict of interest statement

The authors have declared that no competing interests exist.

Figures

Fig 1
Fig 1. Prevalence of Microsporidia in DToL insect genomes.
Microsporidian genomes recovered from insect hosts, split by taxonomic order. F: female, M: male, U: unspecified sex. The silhouettes used in this figure were taken from https://www.phylopic.org, and are all under CC0 1.0 Universal Public Domain Dedication. Credits: Ephemeroptera, Nathan Jay Baker; Psocodea, Christina N. Hodson; Hemiptera, Dave Angelini; Hymenoptera, Emma Kärrnäs; Coleoptera, Kanako Bessho-Uehara; Diptera, Christina N. Hodson; Trichoptera, Christoph Schomburg; and Lepidoptera, Andy Wilson. The data underlying this figure can be found in S1 Table. The figure was generated using ToyTree [73], and manually annotated using InkScape (version 1.2.2).
Fig 2
Fig 2. 600 gene phylogeny of Microsporidia.
(A) ASTRAL [75] phylogeny summarizing individual phylogenies of 600 BUSCO genes (microsporidia_odb10) [76] across all publicly available microsporidian genome assemblies (excluding multiple strains where they are available), and the genome assemblies generated in this study (n = 40, marked in purple). The full phylogeny with all publicly available genomes, including different strains, is found in S3 Fig. Branch lengths were estimated with IQ-TREE using a concatenated alignment of the individual BUSCOs [77]. Nodes with less than 95% support are marked with pink circles. Ploidy is marked in circles at the tips of the tree for genomes where it was characterizable. (B) Genome assembly span (Mb) as calculated by assembly-stats (Github: https://github.com/sanger-pathogens/assembly-stats), with black circles marking chromosome-level genome assemblies. (C) N50 values (Mb) as calculated by assembly-stats (Github: https://github.com/sanger-pathogens/assembly-stats), with asterisks marking purged genome assemblies. (D) BUSCO gene (microsporidia_odb10) completeness percentage, marked in green for single-copy genes, and beige for duplicated genes. (E) Transposable element percentage as predicted by RepeatModeler and RepeatMasker [78,79], marked in burgundy for retroelements, peach for DNA transposons, and blue for rolling circles. Neop.: Neopereziida; Or. Lin.: Orphan Lineage. The data underlying (A) can be found in S1 Text. The data underlying (B), (C), (D), and (E) can be found in S1 Table. The figure was generated using ToyTree [73], and manually annotated using InkScape (version 1.2.2).
Fig 3
Fig 3. Pairwise phylogenetic branch lengths between homeologous gene pairs in tetraploid genomes.
(A) Histograms showing phylogenetic branch lengths (in amino acid substitutions per site) between homeologous gene pairs for tetraploid genomes. The relaxed branch length threshold for species delineation is highlighted in a dashed red line (0.032 amino acid substitutions per site). The percentage of gene pairs that exceed this same-species threshold is given in a box in the top right of each plot. (B) Oxford dot plot of tetraploid ilAceEphe1.µ (from host Acentria ephemerella [Lepidoptera]) using BUSCO genes. Contig boundaries are marked by gray lines. Gene pairs that are less divergent than the same species threshold are in sky blue, while gene pairs that are more divergent than the same species threshold are in red. The data underlying (A) was generated by running BUSCO (microsporidia_odb10, version 5.4.6) [76] on the unpurged genome assemblies of the tetraploid genomes. For each tetraploid, the haplotypes of each BUSCO locus were aligned to one another and an outgroup using MAFFT (version 7.525) [90], and a phylogeny was generated for each alignment using IQ-TREE (version 2.3.4, with ModelFinder enabled) [77, 91]. Subsequently, the branch lengths between homeologous gene pairs were extracted from each phylogeny, and plotted in the histograms seen in (A) using a custom script in S1 Script. The individual BUSCO phylogenies used to derive this data can also be found in File Collection 15 at https://doi.org/10.5281/zenodo.17251512. The BUSCO gene annotations used to generate (B) can be found in File Collection 5 at https://doi.org/10.5281/zenodo.17251512. The figure was generated using Matplotlib [92], and manually annotated using InkScape (version 1.2.2).
Fig 4
Fig 4. Proportion of multi-copy genes which coalesce prior to genomes.
Heatmap showing the fraction of genes that support a more recent homeologue coalescence than between-species coalescence. Fractions greater than 50% are indicated in green, whereas fractions lower than 50% are indicated in purple. The phylogeny is an ASTRAL [75] phylogeny summarizing individual phylogenies of 600 BUSCO genes (microsporidia_odb10) [76] from all publicly available tetraploid assemblies and the tetraploid assemblies generated in this study. The branch lengths were estimated using a concatenated alignment of the individual BUSCOs used, with IQ-TREE [77]. The phylogeny is congruent with the phylogeny in Fig 2. The data underlying this figure can be found in S2 Text. The figure was generated using Matplotlib [92] and ToyTree [73], and manually annotated using InkScape (version 1.2.2).
Fig 5
Fig 5. Nucleotide identity (%) between tetraploid iuLoeVari1. µ haplotypes.
Each haplotype was compared to the other three haplotypes using minimap2 [95], and nucleotide identity (%) between them was plotted for each reference. Each haplotype has a mosaic pattern of identity to the others. The gray shaded area represents a “missing” segment of chromosome 1D, which we suggest is identical to and thus coassembled as the corresponding portion of chromosome 1C, which has double the expected coverage. The top panel of each plot shows mapped read coverage, and the middle panel displays GC content along the chromosome, with average GC content marked by a dashed red line. The coverage data underlying this figure was generated by mapping the PacBio reads against the genome using minimap2, and extracting read depth data using samtools and bedtools [96,97]. The GC data was generated by running seqkit fx2tab [98] on the genome. The genome can be found in File Collection 12 at https://doi.org/10.5281/zenodo.17251512. The genome’s BioSpecimenID can be found in S1 Table, and can be used to retrieve the associated PacBio reads from NCBI [99]. The figure was generated using Matplotlib [92], and manually annotated using InkScape (version 1.2.2).
Fig 6
Fig 6. Hi-C heatmap for the tetraploid genome of iuLoeVari1.µ.
Hi-C contact maps are heatmaps that visualize the frequency of physical contacts between genomic regions in 3D-space. Regions that are closer together physically tend to show more interactions, appearing as darker colors on the map. The strongest signal, in dark red here, is always found along the diagonal, which represents self–self interactions (i.e., each genomic region interacting with itself and nearby regions along the same chromosome). Off-diagonal signals represent interactions between different chromosomes. (A) Hi-C contact map of the tetraploid iuLoeVari1.µ genome (host Loensia variegata [Psocodea]). Each chromosome, with its four copies, is highlighted by a yellow box. (B) Hi-C contact map showing the interactions amongst the four copies of chromosome 1 and the four copies of chromosome 2. Green lines highlight interactions belonging to unit 1, and purple lines highlight interactions belonging to unit 2. Dotted lines indicate interactions between chromosomes 1 and 2. (C) Summary metrics for the genome assemblies of units A/B and C/D. The data underlying this figure was generated by mapping the Hi-C reads to the genome using the sanger-tol/curationpretext pipeline [102] (excluding multi-mapping reads). The genome can be found in File Collection 12 at https://doi.org/10.5281/zenodo.17251512. The genome’s BioSpecimenID can be found in S1 Table, and can be used to retrieve the associated Hi-C reads from NCBI [99]. The figure was generated using PretextView [103], and manually annotated using InkScape (version 1.2.2).
Fig 7
Fig 7. Age distributions of duplicate gene pairs.
Histograms showing synonymous divergence (Ks) distributions for candidate paralogous BUSCO gene pairs from representative diploid genomes. No evidence of recent rediploidisation events is seen, as there are no peaks against a background exponentially-decaying distribution coming from small-scale gene duplication events. The y-axis is highly variable due to different BUSCO gene family expansions occurring in different lineages, yielding larger counts of possible paralogous gene pairs. wgd was used to identify paralogous genes in every genome and compute Ks values [104]. The data underlying this figure can be found in File Collection 16 at https://doi.org/10.5281/zenodo.17251512. The figure was generated using Matplotlib [92], and manually annotated using InkScape (version 1.2.2).
Fig 8
Fig 8. Binning tetraploid genomes into four subgenomes using BUSCO genes.
(A) Using a greedy algorithm, we iterated through contigs from largest to smallest, appending a contig to a haplotypic subgenome if the duplication contributed by that contig does not exceed a specified threshold (x axes in the figure). Single-copy BUSCO gene completeness is marked by circles and multi-copy BUSCO gene completeness is marked by crosses. A red dashed line denotes the BUSCO completeness score of the unbinned assembly. For (B) idChiSpeb1.µ and (C) ilAceEphe1.µ, we plotted the largest 10 contigs in subgenome 1 with their BUSCO genes, and coloured these genes in the other subgenomes by their positions in subgenome 1. The BUSCO annotations underlying this figure can be found in File Collection 5 at https://doi.org/10.5281/zenodo.17251512. The figure was generated using gerbil (https://github.com/Amjad-Khalaf/gerbil), and manually annotated using InkScape (version 1.2.2).
Fig 9
Fig 9. Synteny plots of chromosomal microsporidian genome assemblies.
Genome-wide synteny plots of all chromosomal microsporidian genome assemblies for (A) Enterocytozoonida, Nosematida, and Neopereziida; and (B) Amblyosporida and the Orphan lineage. Each line represents a single-copy BUSCO (microsporidia_odb10) [76]. In (A) BUSCOs are painted by their chromosomal position in A. locustae, while in (B) they are painted by their chromosomal position in H. tvaerminnensis. The attached phylogeny is an ASTRAL phylogeny summarizing individual phylogenies of 600 BUSCO genes (microsporidia_odb10) [76]. The branch lengths were subsequently estimated using a concatenated alignment of the individual BUSCOs used, with IQ-TREE [77]. The BUSCO annotations underlying this figure can be found in File Collection 5 at https://doi.org/10.5281/zenodo.17251512. The figure was generated using the ribbon plotting script in https://github.com/conchoecia/odp [109] and ToyTree [73], and manually annotated using InkScape (version 1.2.2).
Fig 10
Fig 10. Simplified proposed generalized lifecycle for Microsporidia.
Our proposed model posits that each nucleus is a diploid, and that microsporidian reproduction mirrors reproduction in Fungi with stages similar to karyogamy, plasmogamy, and a stable “heterokaryon” (known as a diplokaryon in Microsporidia). Importantly, both the diplokaryotic and monokaryotic phases are parasitic, and species may spend most of their lifecycle in one or the other phase, giving rise to “diploid” and “tetraploid” lineages. The figure was manually drawn using InkScape (version 1.2.2).

References

    1. Keeling P. Five questions about microsporidia. PLoS Pathog. 2009;5(9):e1000489. doi: 10.1371/journal.ppat.1000489 - DOI - PMC - PubMed
    1. Nageli C. uber die neue Krankheit der Seidenraupe und verwandte Organismen. [Abstract of report before 33. Versamml. Deutsch. Naturf. u. Aerzte. Bonn, 21 Sept.]. Bot Ztg. 1857;15: 760–761. Available from: https://cir.nii.ac.jp/crid/1573105974684833920
    1. Pasteur L. Etudes sur la maladie des vers à soie: 2.: Notes et documents. Gauthier-Villars; 1870. Available from: https://play.google.com/store/books/details?id=y-1rmRQoAa4C
    1. Bojko J, Reinke AW, Stentiford GD, Williams B, Rogers MSJ, Bass D. Microsporidia: a new taxonomic, evolutionary, and ecological synthesis. Trends Parasitol. 2022;38(8):642–59. doi: 10.1016/j.pt.2022.05.007 - DOI - PubMed
    1. Stentiford GD, Feist SW, Stone DM, Bateman KS, Dunn AM. Microsporidia: diverse, dynamic, and emergent pathogens in aquatic systems. Trends Parasitol. 2013;29(11):567–78. doi: 10.1016/j.pt.2013.08.005 - DOI - PubMed

LinkOut - more resources