

Cervical cord atrophy correlates with intracranial lesion burden in tumefactive multiple sclerosis
- PMID: 41120625
- PMCID: PMC12540507
- DOI: 10.1007/s00415-025-13431-3
Cervical cord atrophy correlates with intracranial lesion burden in tumefactive multiple sclerosis
Abstract
Background: Spinal cord atrophy associates with motor disability in multiple sclerosis (MS). The influence of intracranial lesion burden (ILB) on spinal cord atrophy requires further investigation. Tumefactive MS (TMS) offers a model for studying the contribution of ILB on spinal cord atrophy.
Objectives: Determine the relationship between upper cervical cord (UCC) area, ILB, and progressive TMS.
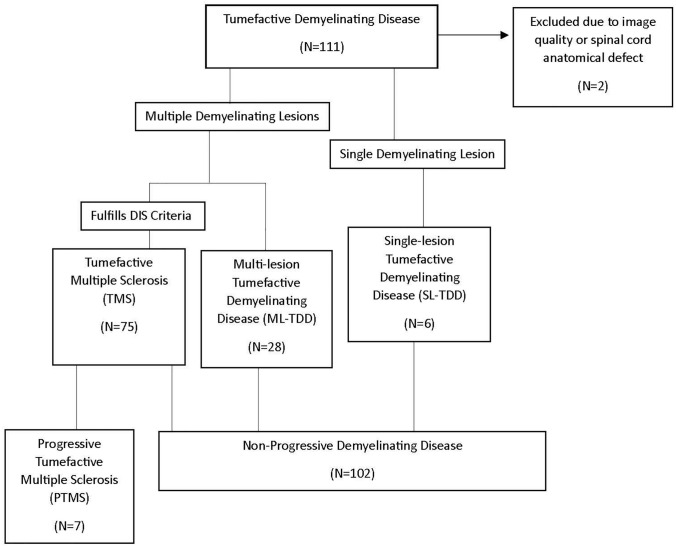
Methods: Individuals with tumefactive demyelinating disease (TDD) undergoing UCC area analysis (C1-C3) were stratified into three groups based on ILB: single-lesion (SL-TDD), multiple-lesion (ML-TDD), and tumefactive MS (TMS). Descriptive characteristics and UCC area were compared across radiological and clinical phenotypes.
Results: Of 109 individuals, six (6%) were SL-TDD, 28 (26%) ML-TDD, and 75 (69%) TMS. All seven (6%) with progressive MS met TMS criteria. TMS had more spinal cord (63% vs. 26%; p = 0.003), and lateral tract lesions (54% vs. 14%; p = 0.001), and a higher final EDSS [median 2.5 (IQR 1.5,3.0) vs. 2.0 (0.0,2.0); p = 0.01] than ML-TDD. After excluding individuals with UCC lesions, there was an inverse trend between median C2 area and ILB across groups: SL-TDD, 56.3 mm2 (47.9,69.0); ML-TDD, 53.4 mm2 (37.2,63.2), and TMS, 50.8 mm2 (32.0,64.3); p = 0.08.
Conclusions: During the course of TMS, early disability may be driven by a single tumefactive lesion while late disability is related to the accrual of intracranial lesions, spinal cord disease, and UCC atrophy. Across the TMS spectrum, there appears to be an inverse relationship between UCC area and ILB, partially independent of UCC lesions which trended towards statistical significance, warranting further investigation.
Keywords: Atrophy; Demyelinating disease; Disability; Lesion burden; Spinal cord; Upper Cervical Cord (UCC).
© 2025. The Author(s).
Conflict of interest statement
Declarations. Conflicts of interest: Albert Aboseif is sponsored by the Eugene and Marcia Applebaum Fellowship Award through the Center for Multiple Sclerosis and Autoimmune Neurology, Mayo Clinic. Caitlin S. Jackson-Tarlton reports consulting/advisory for EMD Serono, Novartis, Roche, Biogen, Amgen Horizon, and clinical trial support from Roche. Christopher G. Schwarz receives research funding from NIH. Paul A. Decker reports no disclosures. Matthew L. Kosel reports no disclosures. B. Mark Keegan reports consulting for EMD Serono, Tr1X, Inc, Moderna, royalties from Oxford University Press Mayo Clinic Cases in Neuroimmunology. Kejal Kantarci serves on the Data Safety Monitoring Board for Takeda Pharmaceuticals. She is funded by the National Institutes of Health. Jeanette E. Eckel-Passow reports no disclosures Orhun H. Kantarci reports no disclosures. Burcu Zeydan receives funding from the National Institutes of Health [K12 AR084222]. W. Oliver Tobin has received research grant funding from the National Institutes of Health, the Mayo Clinic Center for MS and Autoimmune Neurology and book royalties from the publication of Mayo Clinic Cases in Neuroimmunology (Mayo Clinic Scientific Press) 2022.
Figures

References
-
- Jackson-Tarlton CS, Keegan BM, Fereidan-Esfahani M et al (2023) Spinal cord and brain corticospinal tract lesions are associated with motor progression in tumefactive multiple sclerosis. Mult Scler Relat Disord 73:104614. 10.1016/j.msard.2023.104614 - PubMed
-
- Lukas C, Knol DL, Sombekke MH et al (2015) Cervical spinal cord volume loss is related to clinical disability progression in multiple sclerosis. J Neurol Neurosurg Psychiatry 86(4):410–418. 10.1136/jnnp-2014-308021 - PubMed
-
- Zeydan B, Gu X, Atkinson EJ, Keegan BM, Weinshenker BG, Tillema JM, Pelletier D, Azevedo CJ, Lebrun-Frenay C, Siva A, Okuda DT, Kantarci K, Kantarci OH (2018) Cervical spinal cord atrophy: an early marker of progressive MS onset. Neurol Neuroimmunol Neuroinflamm 5(2):e435. 10.1212/NXI.0000000000000435 - PMC - PubMed
-
- Keegan BM, Kaufmann TJ, Weinshenker BG, Kantarci OH, Schmalstieg WF, Paz Soldan MM, Flanagan EP (2018) Progressive motor impairment from a critically located lesion in highly restricted CNS-demyelinating disease. Mult Scler 24(11):1445–1452. 10.1177/1352458518781979 - PubMed
MeSH terms
LinkOut - more resources
Full Text Sources
Medical
Miscellaneous
