Comparative Study
. 2025 Oct 21;15(1):36513.
doi: 10.1038/s41598-025-99536-1.

Development, testing and comparison of novel lifestyle-based prediction models for risk of coronary heart disease

Affiliations
Comparative Study

Development, testing and comparison of novel lifestyle-based prediction models for risk of coronary heart disease

Qiaoxin Shi et al. Sci Rep. .

Abstract

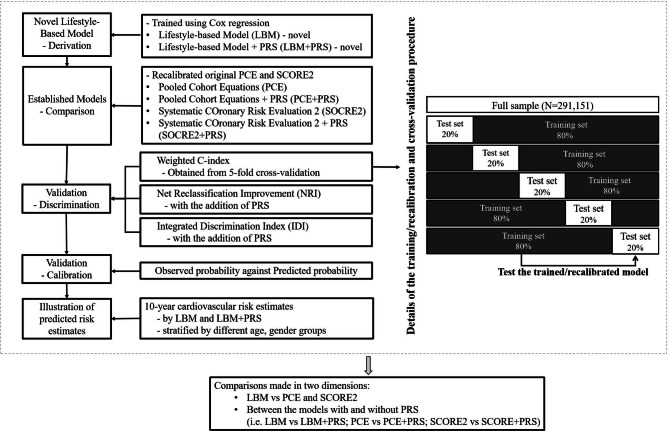
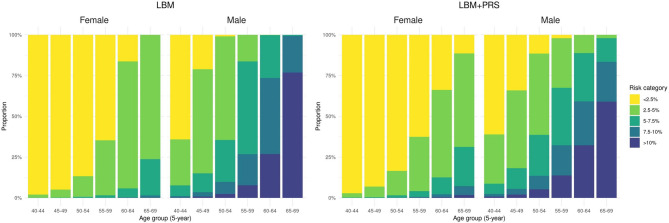
Prediction of coronary heart disease (CHD) risk through standard equations relying on laboratory-based clinical markers has proven challenging and needs advancement. This study aims to derive and cross-validate novel CHD-risk prediction models based on lifestyle behaviours including wearables and polygenic risk scores (PRS), with comparison to the established Pooled Cohort Equations (PCE) and Systematic COronary Risk Evaluation 2 (SCORE2). This study included 291,151 white British individuals of UK Biobank. Cox regression was applied to derive Lifestyle-Based Model (LBM) for CHD-risk prediction incorporating age, sex, body mass index, dietary intake score (0-3; derived from self-reported food types), smoking status, and physical activity (wearable-device-derived Euclidean Norm Minus One). Weighted PRS for CHD was calculated based on 300 genetic variants. Over a median 13.8-year follow-up, 13,063 CHD incidence cases were ascertained. The C-index (indicative of discrimination) of the LBM, PCE and SCORE2 was 0.713 (95% Confidence Interval [CI]: 0.703-0.722), 0.714 (95% CI: 0.705-0.724) and 0.709 (95% CI: 0.700-0.719). Adding PRS to LBM, PCE and SCORE2 increased the C-index to 0.733 (95% CI: 0.724-0.742), 0.726 (95% CI: 0.716-0.735) and 0.721 (95% CI: 0.711-0.730). The LBM with and without PRS both demonstrated good calibration, demonstrating by p-values of 0.997 and 0.999. The addition of PRS to LBM marginally improved calibration, with the slope increasing from 0.981 to 0.983. Integrating PRS rendered a positive categorical net reclassification improvement (cut-off point: 7.5%) of 4.30% for LBM. The non-laboratory-based LBM, integrating wearable-based and anthropometric data, demonstrated moderate cardiovascular risk prediction accuracy, though external validations remain to be explored.

Keywords: Coronary heart disease; Physical activity; Polygenic risk score; Risk prediction modelling; UK biobank.


Conflict of interest statement

Declarations. Competing interests: The authors declare no competing interests. Ethics approval and consent to participate: The UK Biobank was approved by the North-West Multi-Centre Research Ethics Committee (Ref: 11/NW/0382). The present study was approved by the Institutional Review Board of The University of Hong Kong/ Hospital Authority Hong Kong West Cluster (UW 21–542).

Figures

Fig. 1
Fig. 1
Study design, model derivation, and model validation process. Notes: LBM: using age, sex, body mass index (BMI), dietary intake score, smoking status (current, previous, never), and physical activity (mg). LBM + PRS: adding polygenic risk scores to the LBM. PCE: using age, sex, smoking status (yes or no), total and high-density lipoprotein cholesterol (mmol/l), treated or untreated systolic blood pressure (mmHg), and diabetes (yes or no). PCE + PRS: adding polygenic risk scores to the PCE. SCORE2: using age, sex, smoking status (yes or no), total and high-density lipoprotein cholesterol (mmol/l), systolic blood pressure (mmHg), and diabetes (yes or no). SCORE2 + PRS: adding polygenic risk scores to the SCORE2. Abbreviations: CHD = coronary heart disease; CI = confidence interval; IDI = Integrated Discrimination Index; LBM = Lifestyle-Based Model; LBM + PRS = Lifestyle-Based Model plus polygenic risk score; NRI = Net Reclassification Improvement; PCE = Pooled Cohort Equations; PCE + PRS = Pooled Cohort Equations plus polygenic risk score; PRS = polygenic risk score; SCORE2 = Systematic COronary Risk Evaluation 2; SCORE2 + PRS = Systematic COronary Risk Evaluation 2 plus polygenic risk score.
Fig. 2
Fig. 2
Discriminant performance (C-index) of prediction models as identified through 5-fold cross-validation. Notes: LBM: using age, sex, body mass index (BMI), dietary intake score, smoking status (current, previous, never), and physical activity (mg). LBM + PRS: adding polygenic risk scores to the LBM. PCE: using age, sex, smoking status (yes or no), total and high-density lipoprotein cholesterol (mmol/l), treated or untreated systolic blood pressure (mmHg), and diabetes (yes or no). PCE + PRS: adding polygenic risk scores to the PCE. SCORE2: using age, sex, smoking status (yes or no), total and high-density lipoprotein cholesterol (mmol/l), systolic blood pressure (mmHg), and diabetes (yes or no). SCORE2 + PRS: adding polygenic risk scores to the SCORE2. Abbreviations: CHD = coronary heart disease; CI = confidence interval; LBM = Lifestyle-Based Model; LBM + PRS = Lifestyle-Based Model plus polygenic risk score; PCE = Pooled Cohort Equations; PCE + PRS = Pooled Cohort Equations plus polygenic risk score; PRS = polygenic risk score; SCORE2 = Systematic COronary Risk Evaluation 2; SCORE2 + PRS = Systematic COronary Risk Evaluation 2 plus polygenic risk score.
Fig. 3
Fig. 3
Calibration plots and P-values for Greenwood-Nam-D’Agostino (GND) tests across four prediction models. Notes: P-values reported are derived from Greenwood-Nam-D’Agostino tests, which examine the null hypothesis that the observed and predicted probabilities in each group are identical, on average. The slope represents the relationship between the observed and predicted probability, with the slope = 1 suggesting perfect calibration, on average. LBM: using age, sex, body mass index (BMI), dietary intake score, smoking status (current, previous, never), and physical activity (mg). LBM + PRS: adding polygenic risk scores to the LBM. PCE: using age, sex, smoking status (yes or no), total and high-density lipoprotein cholesterol (mmol/l), treated or untreated systolic blood pressure (mmHg), and diabetes (yes or no). PCE + PRS: adding polygenic risk scores to the PCE. SCORE2: using age, sex, smoking status (yes or no), total and high-density lipoprotein cholesterol (mmol/l), systolic blood pressure (mmHg), and diabetes (yes or no). SCORE2 + PRS: adding polygenic risk scores to the SCORE2. Abbreviations: CHD = coronary heart disease; LBM = Lifestyle-Based Model; LBM + PRS = Lifestyle-Based Model plus polygenic risk score; PCE = Pooled Cohort Equations; PCE + PRS = Pooled Cohort Equations plus polygenic risk score; PRS = polygenic risk score; RMSE = Root-mean-square error (the standard deviation of the residuals); SCORE2 = Systematic COronary Risk Evaluation 2; SCORE2 + PRS = Systematic COronary Risk Evaluation 2 plus polygenic risk score.
Fig. 4
Fig. 4
Cumulative incidence of coronary heart disease (CHD) for risk reclassification groups defined based on 10-year CHD risk estimates derived from prediction models. Notes: All participants are divided into four risk reclassification groups according to their 10-year risk estimates predicted by models using the cut-off point of 7.5% for LBM and PCE models; and the cut-off point of 10% for SCORE2. For example, the ‘shared high risk’ category (i.e. 10-year risk estimates ≥ 7.5% by both the LBM and LBM + PRS), followed by ‘up-classified’ (i.e. 10-year risk estimate ≥ 7.5% by LBM + PRS, while 10-year risk estimates < 7.5% by LBM), ‘shared low risk’ (i.e. 10-year risk estimates < 7.5% by both the LBM and LBM + PRS) and ‘down-classified’ (i.e. 10-year risk estimates < 7.5% by LBM + PRS, while 10-year risk estimates ≥ 7.5% by LBM). LBM: using age, sex, body mass index (BMI), dietary intake score, smoking status (current, previous, never), and physical activity (mg). LBM + PRS: adding polygenic risk scores to the LBM. PCE: using age, sex, smoking status (yes or no), total and high-density lipoprotein cholesterol (mmol/l), treated or untreated systolic blood pressure (mmHg), and diabetes (yes or no). PCE + PRS: adding polygenic risk scores to the PCE. SCORE2: using age, sex, smoking status (yes or no), total and high-density lipoprotein cholesterol (mmol/l), systolic blood pressure (mmHg), and diabetes (yes or no). SCORE2 + PRS: adding polygenic risk scores to the SCORE2. Abbreviations: CHD = coronary heart disease; CI = confidence interval; IDI = Integrated Discrimination Index; LBM = Lifestyle-Based Model; LBM + PRS = Lifestyle-Based Model; NRI = Net Reclassification Improvement; PCE = Pooled Cohort Equations; PCE + PRS = Pooled Cohort Equations plus polygenic risk score; PRS = polygenic risk score; SCORE2 = Systematic COronary Risk Evaluation; 2SCORE2 + PRS = Systematic COronary Risk Evaluation 2 plus polygenic risk score.
Fig. 5
Fig. 5
Estimates of 10-year cardiovascular risk distribution based on Lifestyle-Based Models across various age and sex groups. Notes: The figure reflects the 10-year coronary heart disease risk estimates by LBM and LBM + PRS in sex-specific and age-specific groups. LBM: using age, sex, body mass index (BMI), dietary intake score, smoking status (current, previous, never), and physical activity (mg). LBM + PRS: adding polygenic risk scores to the LBM. Abbreviations: LBM = Lifestyle-Based Model; LBM + PRS = Lifestyle-Based Model; NRI = Net Reclassification Improvement.

References

    1. Roth, G. A., Mensah, G. A. & Johnson, C. O. Global burden of cardiovascular diseases and risk factors, 1990–2019: update from the GBD 2019 study. J. Am. Coll. Cardiol.76 (25), 2982–3021 (2020). - PMC - PubMed
    1. Nelson, C. P., Goel, A. & Butterworth, A. S. Association analyses based on false discovery rate implicate new loci for coronary artery disease. Nat. Genet.49 (9), 1385–1391 (2017). - PubMed
    1. Ntalla, I., Kanoni, S. & Zeng, L. Genetic risk score for coronary disease identifies predispositions to cardiovascular and noncardiovascular diseases. J. Am. Coll. Cardiol.73(23), 2932–2942 (2019). - PubMed
    1. Barbaresko, J., Rienks, J. & Nöthlings, U. Lifestyle indices and cardiovascular disease risk: a meta-analysis. Am. J. Prev. Med.55(4), 555–564 (2018). - PubMed
    1. Myers, R. H., Kiely, D. K., Cupples, L. A. & Kannel, W. B. Parental history is an independent risk factor for coronary artery disease: The Framingham Study. Am. Heart. J.120 (4), 963–969 (1990). - PubMed

Publication types

LinkOut - more resources