. 2025 Oct 21;23(1):449.
doi: 10.1186/s12964-025-02452-0.

Phenotype switching in highly invasive resistant to vemurafenib and cobimetinib melanoma cells

Affiliations

Phenotype switching in highly invasive resistant to vemurafenib and cobimetinib melanoma cells

Aleksandra Simiczyjew et al. Cell Commun Signal. .

Abstract

Background: A mutation in the BRAF (serine/threonine-protein kinase B-raf) gene is most often responsible for the progression of melanoma. A breakthrough in its treatment was the application of BRAF and MEK (mitogen-activated protein kinase kinase) inhibitors. Unfortunately, the effectiveness of this therapy is limited due to rapidly emerging resistance to the drugs. We derived two melanoma cell lines resistant to vemurafenib (a BRAF inhibitor)/cobimetinib (an MEK inhibitor). Due to the significant impact of invasion on cancer progression, we focused our further research on this process.

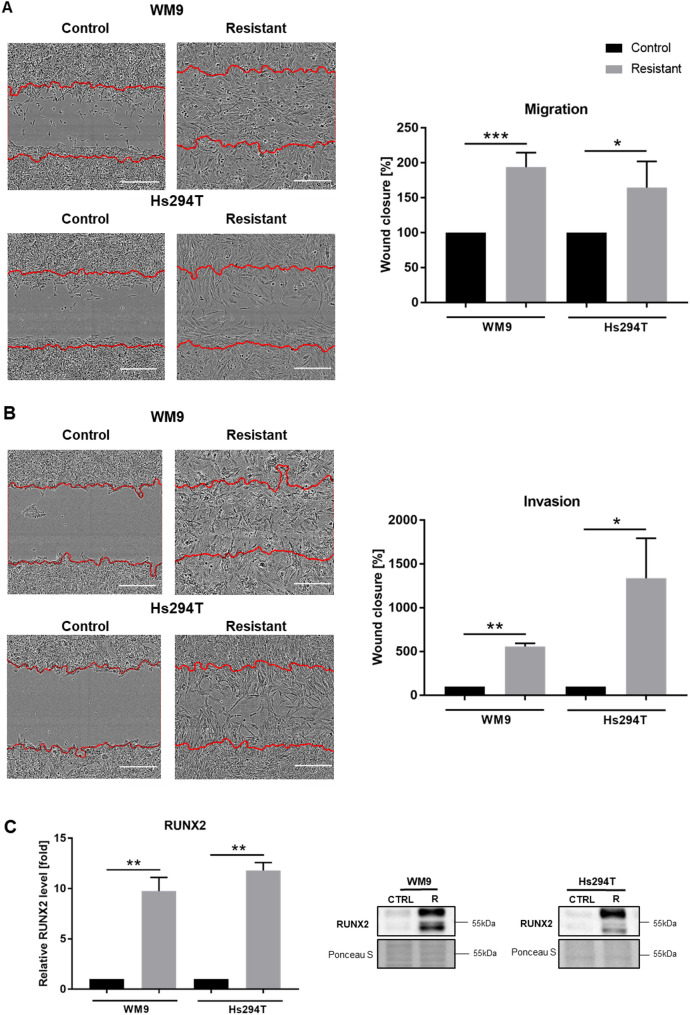
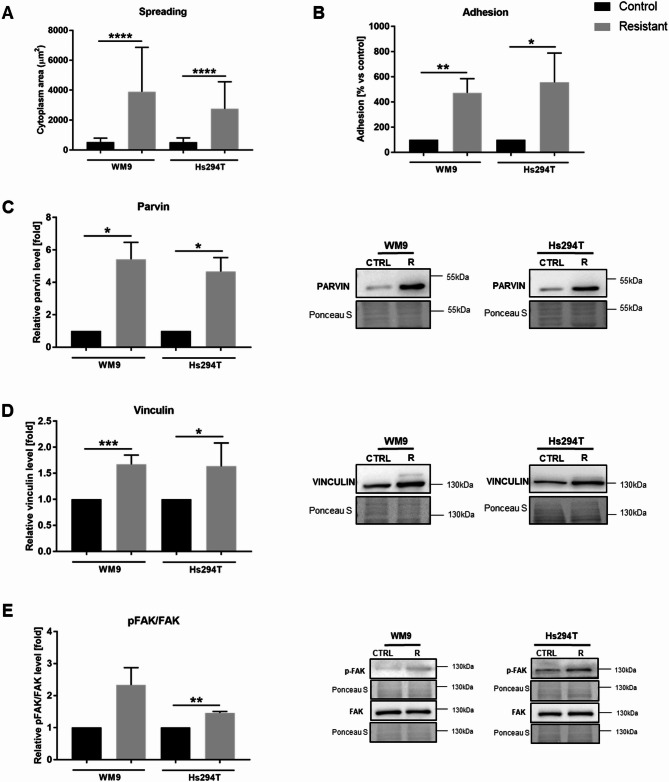
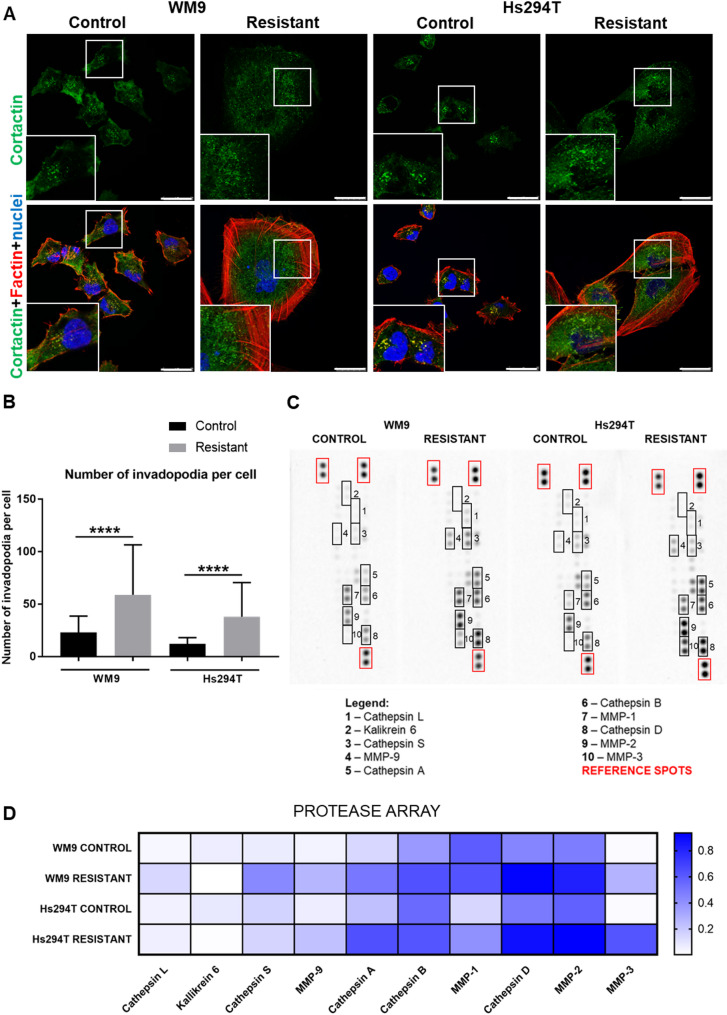
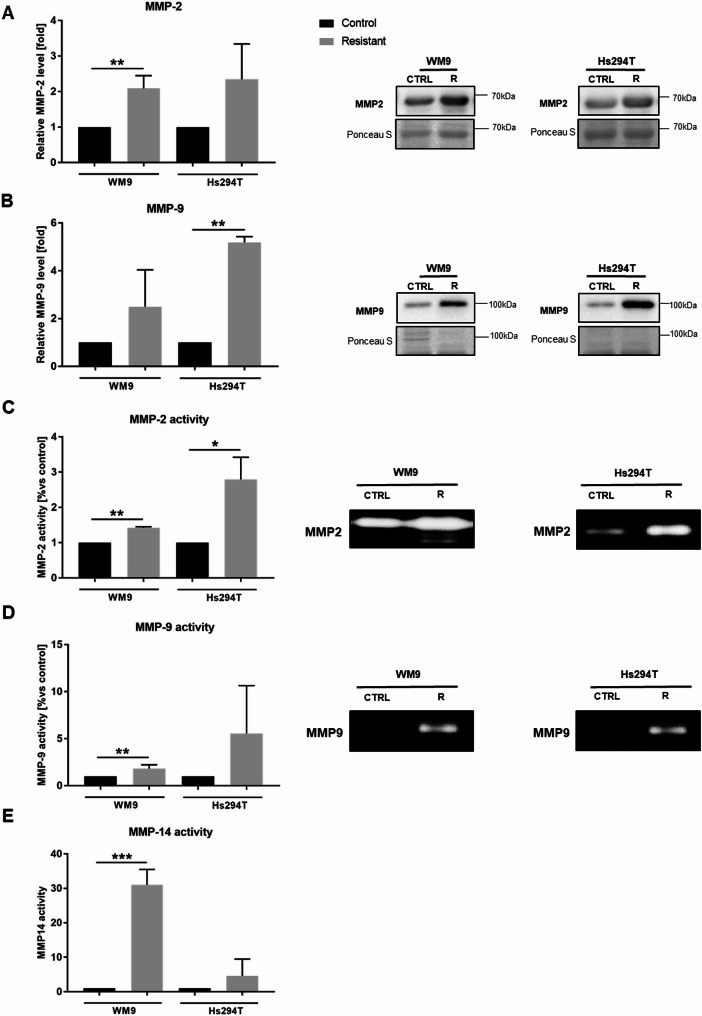
Methods: Cell migration and invasion were assessed via the scratch wound assay. Selected proteins' level as well as the activation of focal adhesion kinase (FAK) were evaluated using Western blotting. The expression of the selected genes was examined by qRT-PCR. The focal adhesions parameters, actin polymerization ratio, as well as YAP/TAZ (Yes-associated protein/transcriptional co-activator with PDZ-binding motif), invadopodia, and β and γ actin localization were analyzed using confocal microscopy. The composition and activity of proteases secreted by cells were determined using a human protease array and gelatin zymography. In addition, cell adhesion and matrix metalloproteinase (MMP14) activity were assessed using appropriate assays.

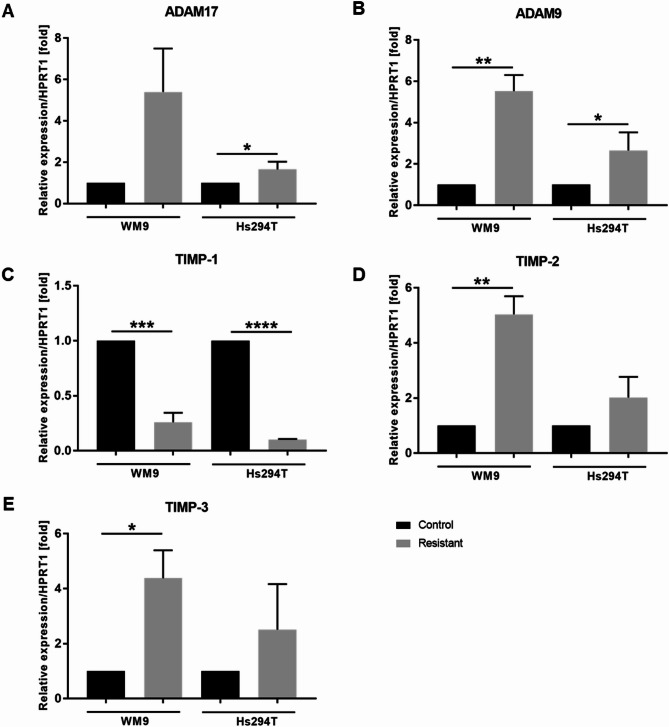
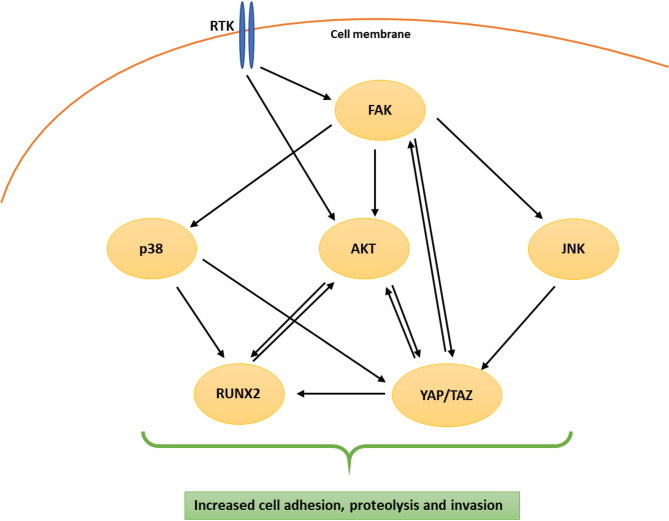
Results: Our analysis showed a greater capacity for migration and invasion of resistant melanoma cells compared to controls, as well as an increase in the level of RUNX2 (runt-related transcription factor 2). Moreover, examined cells exhibited higher adhesion to the surface and were more spread. These cells also formed more focal adhesions. Furthermore, we noticed an increased level of α-parvin and vinculin in resistant cells, as well as an elevated activation of FAK (focal adhesion kinase). Resistance was additionally accompanied by rearrangement of the actin cytoskeleton. Examined cells formed more stress fibers compared to control cells. YAP/TAZ localization became much more nuclear in the resistant ones. The amount of invadopodia was increased, which was reflected by elevated secretion and activation of proteases, as well as altered expression of their inhibitors.

Conclusions: In summary, our study characterized a significantly more invasive phenotype of double-resistant cell lines compared to melanoma cells sensitive to BRAF and MEK inhibitors. Successful inhibition of this phenotype could result in more effective therapy and thus a better prognosis for patients.

Keywords: BRAF inhibitor; Cobimetinib; Drug resistance; MEK inhibitor; Melanoma; Vemurafenib.


Conflict of interest statement

Declarations. Ethics approval and consent to participate: Not applicable. Consent for publication: Not applicable. Competing interests: The authors declare no competing interests.

Figures

Fig. 1
Fig. 1
Migration and invasion of resistant melanoma cells. A scratch wound assay was used to evaluate the rate of migration (A) and invasion (B) of the investigated cells. Representative images of wounds covered by cells in 24 h (migration) or 48 h (invasion) are shown with red lines indicating the initial scratch area. The scale bar is set at 300 μm. The results’ quantification (A, B) is reported as the mean relative wound closure obtained from at least three independent tests ± SD. (C) Western Blotting analysis of RUNX2 level. Ponceau S staining was used to normalize the signal to the total protein content. The blotting membranes shown are representative of at least three independent biological replicates. WM9 and Hs294T cells treated with medium containing DMSO at the concentration used for drug delivery constitute the control (CTRL). Statistical significance was defined as p ≤ 0.05 (*), p ≤ 0.01 (**), and p ≤ 0.001 (***)
Fig. 2
Fig. 2
Focal adhesions’ parameters of control and resistant melanoma cells. (A) Representative images of control and resistant melanoma cells stained for α parvin (green), cell nuclei (blue), and F-actin (red). All labeled structures are visible on merged pictures. Enlargements of focal adhesion-rich areas (boxed) are shown as insets. Scale bar—25 μm. Focal adhesions’ number (B), area (C), and length (D) were calculated based on high-throughput microscope measurements. The analysis was performed for at least 2000 cells representing each condition and in three biological replicates. WM9 and Hs294T cells treated with medium containing DMSO at the concentration used for drug delivery constitute the control (CTRL). Data are presented as the average ± SD. Differences between control and tested cells are indicated by asterisks. Statistical significance was defined as p ≤ 0.0001 (****)
Fig. 3
Fig. 3
Spreading and adhesive properties of control and resistant melanoma cells. (A) Cytoplasm area (cell spreading) was measured based on images visualizing HCS CellMask™ labelling in tested cells using Harmony Opera Phoenix software. (B) The adhesion abilities of the examined cells. Levels of proteins related to cell adhesion: α parvin (C), vinculin (D), and pFAK/FAK ratio (E) were determined using Western blotting analysis. Ponceau S staining was used to normalize the signal to the total protein content. The blotting membranes shown are representative of at least three independent biological replicates. The graphs present average data ± SD from a minimum of three separate experiments. Asterisks indicate statistically important differences between the tested and control cells. WM9 and Hs294T cells treated with medium containing DMSO at the concentration used for drug delivery constitute the control (CTRL). Statistical significance was defined as p ≤ 0.05 (*), p ≤ 0.01 (**), p ≤ 0.001 (***), and p ≤ 0.001 (****)
Fig. 4
Fig. 4
Differences in actin cytoskeleton organization between control and resistant melanoma cells. (A) Representative images of control and resistant melanoma cells stained for filamentous actin (F-actin; red). Enlargements of the stress fibers-rich area (boxed) are presented as insets. Scale bar—25 μm. (B) Filamentous to monomeric (F: G) actin ratio in tested cells, quantified using high throughput confocal microscope. Actin filaments parameters: number (C), length (D), and width (E) were calculated based on confocal images using ImageJ software. The analysis was performed for at least 200 cells representing each condition and for three biological replicates. F Representative images of control and resistant melanoma cells stained for YAP/TAZ (green), F-actin (red), and cell nuclei (blue). All labeled structures are visible on the merged pictures. Scale bar—25 μm. The graphs present average data ± SD from a minimum of three separate experiments. WM9 and Hs294T cells treated with medium containing DMSO at the concentration used for drug delivery constitute the control (CTRL). Asterisks indicate statistically important differences between the tested and control cells. Statistical significance was defined as p ≤ 0.0001 (****)
Fig. 5
Fig. 5
The level and localization of β and γ actin isoforms in control and resistant melanoma cells. The β (A) and γ (B) actin levels were determined by Western blotting analysis. Ponceau S staining was used to normalize the signal to the total protein content. The blotting membranes shown are representative of at least three independent biological replicates. The graphs present average data ± SD from a minimum of three separate experiments. WM9 and Hs294T cells treated with medium containing DMSO at the concentration used for drug delivery constitute the control (CTRL). Asterisks indicate statistically important differences between the tested and control cells. Statistical significance was defined as p ≤ 0.05 (*), p ≤ 0.01 (**). (C) Representative images of control and resistant melanoma cells stained for β (red) and γ (green) actin, and cell nuclei (blue). All labeled structures are visible on the merged pictures. Scale bar—25 μm
Fig. 6
Fig. 6
Invadopodia formation and profile of proteases secreted by resistant melanoma cells. (A) Representative images of control and resistant melanoma cells stained for cortactin (green), cell nuclei (blue), and F-actin (red). All labeled structures are visible on merged pictures. Enlargements of the invadopodia-rich area (boxed) are presented as insets. Scale bar—25 μm. (B) The number of invadopodia was calculated based on cell staining with anti-cortactin antibody for at least 200 cells representing each condition and three biological replicates. The graphs present average data ± SD from a minimum of three separate experiments. Statistical significance was defined as p ≤ 0.0001 (****), and is indicated in the graphs by asterisks. The proteases array served to identify secreted proteases by cells in conditioned media (C). Quantitative analysis was performed based on the obtained signals. Normalized to reference spots, results were presented in the form of a heatmap, where a higher signal intensity is indicated by darker blue. (D) WM9 and Hs294T cells treated with medium containing DMSO at the concentration used for drug delivery constitute the control (CTRL). Abbreviations: MMPs, matrix metalloproteinases
Fig. 7
Fig. 7
Matrix metalloproteinases’ level and activity in resistant melanoma cells. Western Blotting analysis of MMP2 (A) and MMP9 (B) levels in cell-conditioned media derived from control and resistant melanoma cells. MMP2 (C) and MMP9 (D) activity were detected using gelatin zymography analysis of media collected from examined cells. (E) MMP14 activity assay was performed on cell lysates. WM9 and Hs294T cells treated with medium containing DMSO at the concentration used for drug delivery constitute the control (CTRL). Ponceau S staining was used to normalize the signal to the total protein content. Blotting membranes and zymography gels shown are representative of at least three independent biological replicates. Results are presented as the mean ± SD of a minimum of three separate experiments. Asterisks indicate statistically important differences between the tested and control cells. Statistical significance was defined as p ≤ 0.05 (*), p ≤ 0.01 (**), and p ≤ 0.001 (***). Abbreviations: MMPs, matrix metalloproteinases
Fig. 8
Fig. 8
Expression level of genes associated with proteolysis in melanoma cells resistant to BRAFi/MEKi. (A) ADAM17, (B) ADAM9, (C) TIMP1, (D) TIMP2, and (E) TIMP3 mRNA levels in control and resistant melanoma cells. HPRT1 served as the reference gene for Real-Time PCR analysis. WM9 and Hs294T cells treated with medium containing DMSO at the concentration used for drug delivery constitute the control (CTRL). The graphs present average data ± SD from a minimum of three separate experiments. Asterisks indicate statistically important differences between tested and control cells at the level of p ≤ 0.05 (*), p ≤ 0.01 (**), p ≤ 0.001 (***), and p ≤ 0.0001 (****). Abbreviations: ADAM, a disintegrin and metalloproteinase; TIMP, the tissue inhibitor of metalloproteinases
Fig. 9
Fig. 9
Mechanisms of increased invasive capacity of BRAF/MEK inhibitor-resistant melanoma cells presented as the network of mutually interacting proteins. Abbreviations: RTK – receptor tyrosine kinases, FAK - focal adhesion kinase, YAP - Yes-associated protein, TAZ - transcriptional coactivator with PDZ‐binding motif, p38- p38 mitogen-activated protein kinase, JNK- c-Jun N-terminal kinase, AKT- protein kinase B, RUNX2- runt-related transcription factor 2

References

    1. Hartman RI, Lin JY. Cutaneous melanoma-a review in detection, staging, and management. Hematol Oncol Clin North Am. 2019;33:25–38. 10.1016/J.HOC.2018.09.005. - PubMed
    1. Leonardi GC, Falzone L, Salemi R, Zanghì A, Spandidos DA, Mccubrey JA, et al. Cutaneous melanoma: from pathogenesis to therapy (review). Int J Oncol. 2018;52:1071–80. 10.3892/IJO.2018.4287. - PMC - PubMed
    1. Davies H, Bignell GR, Cox C, Stephens P, Edkins S, Clegg S, Teague J, Woffendin H, Garnett MJ, Bottomley W, Davis N, Dicks E, Ewing R, Floyd Y, Gray K, Hall S, Hawes R, Hughes J, Kosmidou V, Menzies A, Mould C, Parker A, Stevens C, Watt S, Hooper S, Jayatilake H, Gusterson BA, Cooper C, Shipley J, Hargrave D, Pritchard-Jones K, Maitland N, Chenevix-Trench G, Riggins GJ, Bigner DD, Palmieri G, Cossu A, Flanagan A, Nicholson A, Ho JWC, Leung SY, Yuen ST, Weber BL, Seigler HF, Darrow TL, Paterson H, Wooster R, Stratton MR, Futreal PA. Mutations of the BRAF gene in human cancer. Nature. 2002;417:949–54. 10.1038/nature00766. - PubMed
    1. Long GV, Stroyakovskiy D, Gogas H, Levchenko E, de Braud F, Larkin J, Garbe C, Jouary T, Hauschild A, Grob JJ, Sileni VC, Lebbe C, Mandalà M, Millward M, Arance A, Bondarenko I, a. JB, Haanen G, Hansson J, Utikal J, Ferraresi V, Kovalenko N, Mohr P, Probachai V, Schadendorf D, Nathan P, Robert C, Ribas A, DeMarini DJ, Irani JG, Casey M, Ouellet D, Martin A-M, Le N, Patel K, Flaherty K. Combined BRAF and MEK Inhibition versus BRAF Inhibition alone in Melanoma, N. Engl. J Med. 2014;140929070023009. 10.1056/NEJMoa1406037.
    1. Manzano JL, Layos L, Bugés C, De los Llanos Gil M, Vila L, Martínez-Balibrea E, Martínez-Cardús A. Resistant mechanisms to BRAF inhibitors in melanoma. Ann Transl Med. 2016;4:1–9. 10.21037/atm.2016.06.07. - PMC - PubMed