. 2025 Oct 22:14:RP104082.
doi: 10.7554/eLife.104082.

Blood pressure variability compromises vascular function in middle-aged mice

Affiliations

Blood pressure variability compromises vascular function in middle-aged mice

Perenkita J Mendiola et al. Elife. .

Abstract

Blood pressure variability (BPV) has emerged as a significant risk factor for cognitive decline and dementia, independent of alterations in average blood pressure (BP). However, the impact of large BP fluctuations on neurovascular function remains poorly understood. In this study, we developed a novel murine model of BPV in middle-aged mice using intermittent angiotensin II infusions. Radio telemetry confirmed that 24 hr BP averages in BPV mice remained comparable to controls, demonstrating BPV in the absence of hypertension. Chronic (20-25 days) BPV resulted in a blunted bradycardic response and cognitive deficits. Two-photon imaging revealed heightened pressure-evoked constrictions (myogenic response) in parenchymal arterioles of BPV mice. While sensory stimulus-evoked dilations (neurovascular coupling) were amplified at higher BP levels in control mice, this pressure-dependent effect was abolished in BPV mice. Our findings indicate that chronic BP fluctuations impair vascular function within the neurovascular complex and contribute to cognitive decline, emphasizing BPV as a critical factor in brain health.

Keywords: autoregulation; blood pressure; bradycardic; cognitive; mouse; myogenic; neuroscience; neurovascular.


Conflict of interest statement

PM, PO, KX, MB, WB, RP, VD, JF No competing interests declared

Figures
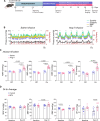
Figure 1.
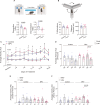
Figure 1.. Experimental design and Ang II infusion effects on mean arterial pressure.
(A) Schematic of the experimental design for middle-aged C57BL/6 J male mice, including implantation of a chronic cranial window (–28 days from treatment onset) and an infusion pump with telemetry (–7 days from treatment onset). Infusion pumps were programmed for intermittent delivery of saline (baseline phase) or angiotensin II (Ang II) (treatment phase) at a rate of 18.4 µg/day, administered in 1 hr intervals every 3–4 hr. In-vivo two-photon (2 P) imaging sessions were performed approximately 20 days into the treatment phase. Behavioral tests were conducted during the baseline period (Test 1) and 25 days into the treatment phase (Test 2). Created with BioRender.com. (B) Representative raw traces depicting minute-to-minute, 24 hr MAP, SBP, DBP, PP, and Activity levels during intermittent saline infusions (left) and Ang II infusions (right). Dashed lines indicate periods of active infusion (1 hr) or when the pump is on. (C) Average MAP, SBP, DBP, and PP (5 min) measured during infusion Off versus On conditions. (D) 24 hr average MAP, SBP, DBP, and PP during a 5 day saline infusion phase (Baseline) and on Day 20 of Ang II treatment. Two-way ANOVA repeated measures followed by Sidak’s multiple comparisons test (C, n=8 BPV mice) (D, n=13 control mice, n=8 BPV mice). Ang II = Angiotensin II, BPV = blood pressure variability, DBP = diastolic blood pressure MAP = mean arterial pressure, P=pulse pressure, SBP = systolic blood pressure.
Figure 1—figure supplement 1.
Figure 1—figure supplement 1.. One-hour averages of MAP over 24 hr-Circadian Profile.
(A) Representative raw trace of one-hour average MAP for 24 hr of all control mice and BPV mice (B), with controls summarized in (C) and BPV in (D). Active corresponds to nighttime hours (6 pm-6 am). (A-D, n=13 control mice, n=8 BPV mice). BPV = blood pressure variability, MAP = mean arterial pressure.
Figure 2.
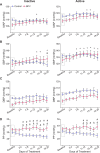
Figure 2.. Effects of pulsatile BP on average 12:12 hr cardiovascular variables.
(A) Summary data of two-day averages of MAP, SBP (B), DBP (C), and PP (D) during the inactive (daylight) period (left column) and the active (nighttime) period (right column). Dashed rectangles indicate the baseline period (~5-day saline infusion). ‘*’ and ‘&’ denote within group comparisons (p<0.05 vs Baseline) for BPV and control, respectively. ‘#’ denotes p<0.05 between groups comparisons. Two-way ANOVA repeated measures followed by Sidak’s comparison test; n = 13 control mice, n = 8 BPV mice. BPV=blood pressure variability, DBP=diastolic blood pressure, MAP=mean arterial pressure, PP=pulse pressure, SBP=systolic blood pressure.
Figure 3.
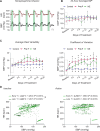
Figure 3.. Chronic BPV suppresses bradycardic reflex.
(A) Representative raw traces of 24 hr SBP (top) and HR (bottom) during intermittent Ang II infusions. (B) Five-minute average HR when the infusion pump is Off or On (actively infusing Ang II) for control and BPV groups, extracted from the inactive (daytime) period. (C) Twenty-four-hour average HR during the baseline period (~5 day saline infusion), and on day 20 of treatment (Day 20) for control and BPV mice. (D) Scatter plot of SBP and HR during Ang II infusion (100 min: 20 min before and after the 60 min pulse) in the inactive period for control and BPV mice (E). Linear trend lines for data shown in the insert. Early and Late periods correspond to days 3–5 and days 23–25 of the treatment phase, respectively. (F) Scatter plot of SBP and HR during the active period in controls and in BPV mice (G). Two-way ANOVA repeated measures followed by Sidak’s multiple comparisons test (B-C, n=6 control mice, n=8 BPV mice). Simple linear regression and ‘#’ denotes p<0.05 within group (D, F, n=6 control mice) (E, G, n=8 BPV mice). bpm = beats per minute, BPV = blood pressure variability, HR = heart rate, SBP = systolic blood pressure.
Figure 3—figure supplement 1.
Figure 3—figure supplement 1.. Transient Ang II infusions induced pulsatile blood pressure in control mice.
Summary data of averaged BP (5 min) while the pump is Off or On and infusing Ang II in controls. Data was extracted from the inactive (daytime) period at days 3–5 of treatment protocol. Paired Wilcoxon test (n=6 control mice). DBP = diastolic blood pressure, MAP = mean arterial pressure, P=pulse pressure, SBP = systolic blood pressure.
Figure 4.
Figure 4.. Norepinephrine infusion effects.
(A) Representative raw trace of minute-to-minute 24 hr HR (top) and SBP (bottom). The green-shaded region indicates the 1 hr period when the pump is actively infusing NE (45 µg/kg/min). (B) Summary data of two-day average MAP during the baseline phase (Dashed rectangle, ~5 day saline infusion) and over 20 days of treatment. (C) Summary data of calculated two-day ARV of SBP (left) and CV of SBP (right). (D) Scatter plot of SBP and HR during NE infusion (100 min window: 20 min before and after the 60 min pulse) in the inactive (left) and active (right) periods, with linear trend lines shown in the insert. Early and Late periods correspond to days 3–5 and days 16–20 of the treatment phase. ‘*’ and ‘#’ denote within group comparisons (p<0.05 vs Baseline) for Ang II- and NE-infused mice, respectively. ‘&’ and ‘∆’ denotes between group comparisons (p<0.05 vs control group) for Ang II- and NE-infused mice, respectively. Two-way ANOVA repeated measures followed by Sidak’s multiple comparisons test (B-C, n=6 mice). Simple linear regression (D, n=3 mice). Ang II = Angiotensin II, bpm = beats per minute, HR = heart rate, NE = norepinephrine, SBP = systolic blood pressure.
Figure 5.
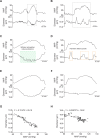
Figure 5.. Enhanced myogenic responses in parenchymal arterioles of BPV mice.
(A) Schematic of the experimental set-up, including a portable telemetry system for continuous blood pressure recordings alongside simultaneous 2 P imaging of parenchymal arteriole diameter. Created with BioRender.com. (B) Summary data for the average imaging depth below the brain surface. (C) Summary data for the average baseline diameters of imaged parenchymal arterioles. (D) Summary data of the average MAP recorded under infusion pump off conditions (low blood pressure, Low BP) and infusion pump on conditions (high blood pressure, High BP). (E) Representative raw trace (from a single mouse) showing MAP (top) and parenchymal arteriole diameter (bottom) over time. (F) Expanded data corresponding to dashed region in (E), highlighting Ang II-evoked BP changes. (G) Representative scatter plot and linear regression of MAP vs parenchymal arteriole diameter during an imaging session. (H) Summary data of MAP-diameter linear regression slopes. (I) Relationship between minimum MAP recorded during an imaging run and the slope shown in (H); dashed lines indicate the percent ∆ change in MAP relative to its minimum value. The insert provides a summary of percent ∆ change in MAP from the minimum MAP. (J) Scatter plot of MAP vs changes in arteriole diameter from baseline pressure (~70 mmHg), spanning a pressure range 46–122 mmHg. Data subsets extracted from (J): (K) MAP ≤51 mmHg (orange dashed region), (L) MAP 51-100 mmHg (green dashed region), and (M) MAP ≥101 mmHg (blue dashed region). (N) Illustration of the proposed leftward shift (and narrower plateau) in cerebral autoregulatory curve induced by chronic BPV. Created with BioRender.com. Unpaired t-test and Mann-Whitney test (B-C, H-I, n=10 runs/8 control mice, n=11 runs/8 BPV mice). Two-way ANOVA repeated measures followed by Sidak’s multiple comparison test (D, n=10 runs/8 control mice, n=11 runs/8 BPV mice). Simple linear regression and ‘#’ denotes p<0.05 between group (J-M, n=12 runs/9 control mice, n=8 runs/7 BPV mice). BPV = blood pressure variability, MAP = mean arterial pressure.
Figure 5—figure supplement 1.
Figure 5—figure supplement 1.. Directional myogenic responses.
(A) Summary data for averaged BP corresponding to the Low-to-High BP transition. (B) Representative raw trace showing MAP (top) and parenchymal arteriole diameter (bottom) during Low-to-High MAP transition shaded in orange (left) and the corresponding representative scatter plot of MAP vs parenchymal arteriole diameter (right). (C) Summary of MAP-diameter linear regression slopes corresponding to Low-to-High MAP transition. (D) Summary data of the average high and low MAP recorded immediately following cessation of pump infusion and blood pressure transitions from high to low BP (High-to-Low). (E) Representative raw trace showing MAP (top) and parenchymal arteriole diameter (bottom) during High-to-Low MAP transition shaded in green (left) and the corresponding representative scatter plot of MAP vs parenchymal arteriole diameter (right). (F) Summary of MAP-diameter linear regression slopes corresponding to High-to-Low MAP transition. Two-way ANOVA repeated measures followed by Sidak’s multiple comparisons test (A, n=12 runs/7 control mice, n=14 runs/8 BPV mice) (D, n=10 runs/8 control mice, n=12 runs/7 BPV mice). Unpaired t-test and Mann-Whitney test (C, n=12 runs/7 control mice, n=14 runs/8 BPV mice) (F, n=10 runs/8 control mice, n=12 runs/7 BPV mice). BPV = blood pressure variability, MAP = mean arterial pressure.
Figure 5—figure supplement 2.
Figure 5—figure supplement 2.. Exclusion criteria for myogenic response analysis.
(A–B) Representative raw traces (from one mouse) of MAP (top) and parenchymal arteriole diameter (bottom) showing WS-evoked dilations (A) and random dilatory events (B). Gray dashed rectangles outline the period when the pump is on and BP transitions to higher values (Ang II infusion). (CF) Expanded data corresponding to the dashed rectangle shown in (A–B), with dilatory responses to WS outlined within green dashed rectangles (C) and transient dilatory events shown within orange dashed rectangles (D). (EF) Representative raw traces of MAP (top) and parenchymal arteriole diameter (bottom) following removal of sensory-evoked dilations (C) or the random dilatory events outlined in (D). (GH) Scatter plot and resultant linear regression line of the filtered MAP vs parenchymal diameter corresponding to (E–F). MAP = mean arterial pressure.
Figure 6.
Figure 6.. Suppressed neurovascular responses in parenchymal arterioles of BPV during low and high blood pressure periods.
(A) Schematic of the experimental setup in which a picospritzer delivered a puff of air for whisker stimulation (WS) at 10 Hz for 20 s. Created with BioRender.com. (B) Representative image showing the mask (outlined) used to track changes in parenchymal arteriole diameter. (C) Summarized data of average MAP recorded during low blood pressure (Low BP; pump off) and high blood pressure (High BP; pump on) conditions. (D) Summary data of the average imaging depth below the brain surface. (E) Representative raw trace (from a single mouse) showing MAP (top) and parenchymal arteriole diameter (bottom) during low and high blood pressure. Dashed green squares indicate WS response, with ‘a’ denoting the 30 s pre-stimulus diameter and ‘b’ denoting the 30 s post-stimulus diameter, summarized in (F). (G) Normalized averaged arteriole diameter traces with corresponding error bars (dashed lines) during the WS response, shown as % change from baseline (20 s before stimulus), during the 20 sstimulus (green shaded region), and 64 s post-stimulus (green dashed square). (H) Summarized data of stimulus-induced arteriole responses (green shaded region in G). (I) Summary data of recovery time, with rate of decay (ƙ) corresponding to 30 s post-stimulus period outlined in the green dashed square in (G). Two-way ANOVA repeated measures followed by Sidak’s multiple comparisons test (CD, n=7 control mice, 5 BPV mice) (F, n=5–8 control mice, n=6–7 BPV mice) and (H, n=5–8 control mice, n=6–7 BPV mice). One-phase exponential decay nonlinear fit (I, n=5–8 control mice, n=6–7 BPV mice). BPV = blood pressure variability, k=rate of decay, MAP = mean arterial pressure, WS = whisker stimulation.
Figure 6—figure supplement 1.
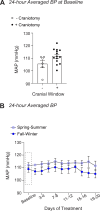
Figure 6—figure supplement 1.. Seasonal effects on mean arterial pressure.
(A) Summarized data of 24 hr MAP at baseline (5 days saline infusion) in mice with (+) or without (-) a cranial window. (B) Summarized data of two-day average MAP at baseline and 20 days of treatment. Spring-Summer corresponds to warmer months (May-September), and Fall-Winter corresponds to colder months (October-April). Mann-Whitney test (A, n=14 mice with craniotomy, 6 without craniotomy). Two-way ANOVA repeated measures followed by Sidak’s multiple comparisons test (B, n=11 mice in Spring-Summer, 9 mice in Fall-Winter). MAP = mean arterial pressure.
Figure 7.
Figure 7.. Behavior and altered cognitive function of BPV mice.
(A) Schematic of the novel object recognition test with a 1 hr delay between the A-A and A-B trials (top), accompanied by summarized recognition and discriminatory index data for mice during the saline infusion period (baseline) and following 25 days of pulsatile Ang II infusion (Ang II). Created with BioRender.com. (B) Diagram of 10 min spontaneous Y-maze experimental setup (top) and the summary of % alternation and distance traveled during baseline and after 25 days of Ang II treatment (bottom). (C) Summary data of two-day, 24 hr activity averages throughout treatment during active and inactive periods, with the Baseline phase (~5 day saline infusion) marked by the dashed rectangle. (D) Summary data of 24 hour averaged activity recorded when the infusion pump was on vs off during Early (days 3–5) and Late (days 23–25) treatment phases. (E) Summary of activity when the pump is on vs off during the Early and Late phases of treatment for the inactive cycle. (F) Summary of activity when the pump is on vs off during the Early and Late phases of treatment for the active cycle. Paired t-test (A, n=10 BPV mice), (B, n=11 BPV mice). Two-way ANOVA repeated measures followed by Tukey’s comparison test (C, n=13 control mice, n=8 BPV mice) (D-F, n=6 control mice, n=8 BPV mice). ‘*’ denotes p<0.05 vs Baseline for control, active period. ‘$’ and ‘∆’ denote p<0.05 (active vs inactive period) for control and BPV, respectively. AU = arbitrary units, BPV = blood pressure variability.

Update of

References

    1. Al-Merani SA, Brooks DP, Chapman BJ, Munday KA. The half-lives of angiotensin II, angiotensin II-amide, angiotensin III, Sar1-Ala8-angiotensin II and renin in the circulatory system of the rat. The Journal of Physiology. 1978;278:471–490. doi: 10.1113/jphysiol.1978.sp012318. - DOI - PMC - PubMed
    1. Antunes M, Biala G. The novel object recognition memory: neurobiology, test procedure, and its modifications. Cognitive Processing. 2012;13:93–110. doi: 10.1007/s10339-011-0430-z. - DOI - PMC - PubMed
    1. Baggeroer CE, Cambronero FE, Savan NA, Jefferson AL, Santisteban MM. Basic mechanisms of brain injury and cognitive decline in hypertension. Hypertension. 2024;81:34–44. doi: 10.1161/HYPERTENSIONAHA.123.19939. - DOI - PMC - PubMed
    1. Benfato ID, Quintanilha ACS, Henrique JS, Souza MA, Rosário BDA, Beserra Filho JIA, Santos RLO, Ribeiro AM, Le Sueur Maluf L, de Oliveira CAM. Effects of long-term social isolation on central, behavioural and metabolic parameters in middle-aged mice. Behavioural Brain Research. 2022;417:113630. doi: 10.1016/j.bbr.2021.113630. - DOI - PMC - PubMed
    1. Böhm M, Schumacher H, Leong D, Mancia G, Unger T, Schmieder R, Custodis F, Diener HC, Laufs U, Lonn E, Sliwa K, Teo K, Fagard R, Redon J, Sleight P, Anderson C, O’Donnell M, Yusuf S. Systolic blood pressure variation and mean heart rate is associated with cognitive dysfunction in patients with high cardiovascular risk. Hypertension. 2015;65:651–661. doi: 10.1161/HYPERTENSIONAHA.114.04568. - DOI - PubMed

LinkOut - more resources