. 2025 Oct 24;11(43):eady7904.
doi: 10.1126/sciadv.ady7904. Epub 2025 Oct 22.

Leptin as a key driver for organ fibrogenesis

Affiliations

Leptin as a key driver for organ fibrogenesis

Xue-Nan Sun et al. Sci Adv. .

Abstract

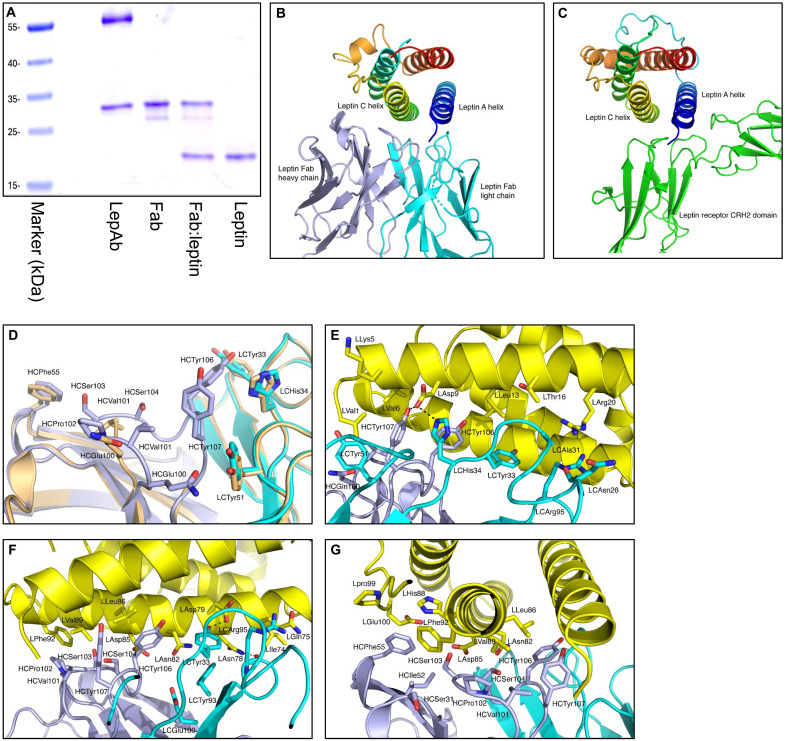
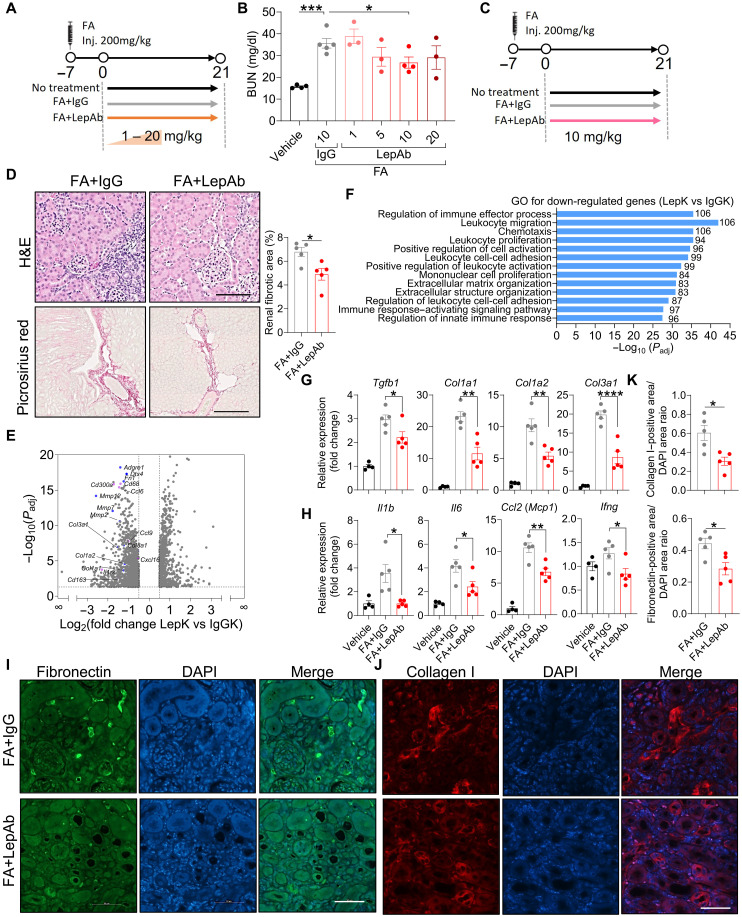
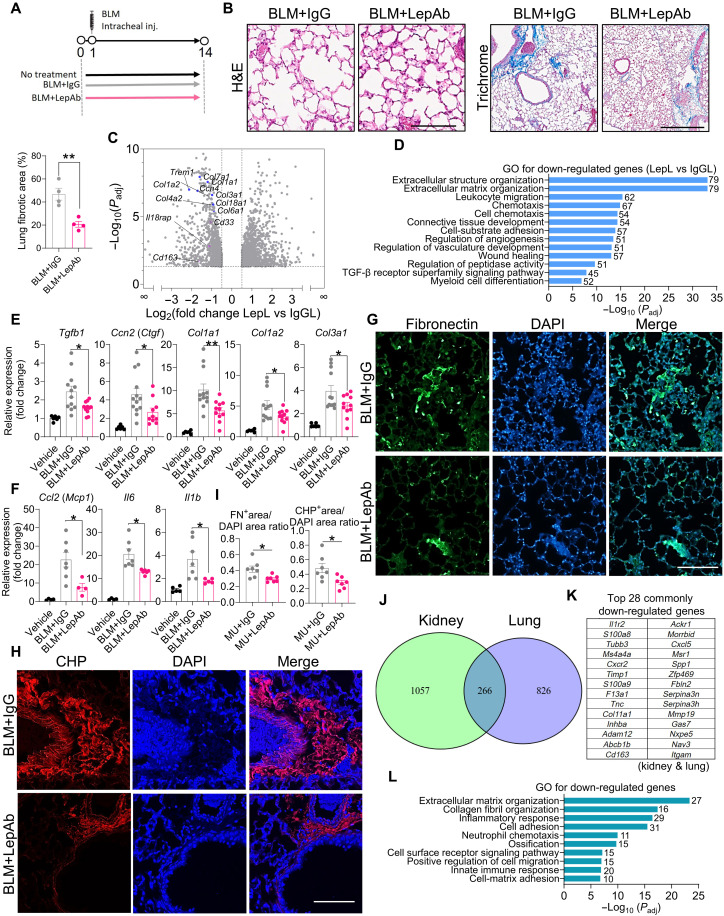
Leptin, a hormone primarily secreted by adipocytes, regulates energy balance and systemic metabolism through its interaction with the leptin receptor (LEPR). Beyond these functions, leptin signaling has been implicated in the pathogenesis of tissue fibrosis. Here, we report the x-ray crystal structures of a leptin-neutralizing antibody (hLep3) in the unbound and leptin-bound states. The interaction of this antibody with leptin mimics the interaction of the LEPR with leptin, providing direct insights into the mechanism by which the antibody disrupts leptin signaling. We furthermore evaluate the therapeutic potential of neutralizing leptin with this antibody across distinct mouse models of fibrosis affecting the kidney, liver, lung, heart, and blood vessels. Leptin neutralization markedly inhibited fibrosis progression in all models. Mechanistically, suppression of leptin activity reduces pro-inflammatory and profibrotic processes, underscoring its therapeutic potential. These findings suggest that leptin signaling plays a vital role in tissue fibrosis and that treatment with a leptin-neutralizing antibody may be a promising therapeutic approach.


Figures

Fig. 1.
Fig. 1.. Structural characterization of a leptin-neutralizing antibody.
(A) SDS-PAGE gel of a leptin-neutralizing antibody, Fab, Fab: leptin complex, and leptin under reducing conditions. (B and C) The interaction of the Fab with leptin mimics the LEPR CRH2 domain, which predominantly binds helix A of leptin, while the Fab also interacts with both helices A and C and the loop between helices C and D of leptin. (D) The superposition of the unbound Fab (orange) and Fab:leptin complex (light chain, cyan; heavy chain, light blue) shows conformational changes, with a root mean square deviation of 0.44 Å for 220 Cα atoms. The largest difference occurs in the CDR H3 loop (heavy chain residues 100 to 107), where residues 102 to 107 are unmodeled in the unbound Fab because of a lack of interpretable electron density. (E) Fab heavy and light chains interact with conserved residues on leptin helix A (yellow), identified by CCP4’s Ncont (≤5.0 Å) (72). Fab light and heavy chains are shown in cyan and light blue, respectively. Residues are labeled L (leptin), HC (heavy), and LC (light). Hydrogen bonds are depicted as dashed black lines. (F) Fab heavy and light chains interact with conserved residues on leptin’s helix C. For clarity, selected interactions from (D) are not shown. Hydrogen bonds are depicted as dashed black lines. (G) Residues from the Fab heavy chain interact with conserved residues of the leptin’s helix C and the loop between helices C and D. The charged carboxylate of LGlu100 points away from the hydrophobic cluster of HCPhe55, LHis88, and LPhe92. For clarity, selected interactions from (C) are not shown. Leptin helices A and C and the residues from the loop between helices C and D contribute to all the interactions with the heavy and light chains of the neutralizing antibody.
Fig. 2.
Fig. 2.. Local leptin signaling is elevated in liver and kidney fibrosis.
For liver fibrosis induction, Mup-uPA (MU) mice and control littermates were fed an HFD for 12 weeks and then euthanized. For kidney fibrosis induction, wild-type mice were injected with folic acid (FA; 200 mg/kg) or vehicle and euthanized at day 7. (A and B) RT-qPCR analysis of total and long-isoform LEPR (Lepr and Leprb, respectively) mRNA expression in livers (A) (n = 4 to 7 per group) and kidneys (B) (n = 4 to 6 per group). (C and D) Immunoblot analysis of p-STAT3, STAT3, and SOCS3 protein expression in livers (C) (n = 3 per group) and kidneys (D) (n = 4 per group). Data are presented as the means ± SEM and were analyzed by a one-tailed Student’s t test. *P < 0.05; **P < 0.01; ***P < 0.001.
Fig. 3.
Fig. 3.. Leptin neutralization diminishes kidney fibrosis.
(A) Experimental setup of folic acid–induced kidney fibrosis. (B) Serum BUN levels. (C) Schematic for mice that were subjected to LepAb treatment following folic acid–mediated acute kidney injury. (D) H&E and picrosirius red staining of kidney. Representative microphotographs are shown (n = 5 per group). Scale bars equal 125 μm (H&E staining) and 250 μm (Picrosirius red staining). (E) Volcano plots display the fold change (x axis) versus adjusted P value (y axis) of transcriptomic data from kidneys of IgG-treated (IgGK) versus leptin antibody–treated (LepK) mice. Mean values from n = 3 per group. (F) Labels identify gene clusters showing enrichment GO analyses for LepK versus IgGK. (G and H) RT-qPCR analysis of fibrotic (G) and inflammatory (H) gene mRNA expression in the kidney (n = 4 or 5 per group). DAPI, 4′,6-diamidino-2-phenylindole. (I and J) Immunofluorescence staining of fibronectin (FN) and collagen I (COL1) of the kidney. Representative microphotographs are shown (n = 5 per group). The scale bar equals 50 μm. (K) Quantification of immunofluorescence staining for FN (I) and COL1 (J) in the kidney. [(C), (D), (G), (H), and (K)] Data are presented as the means ± SEM and were analyzed by a two-tailed Student’s t test or one-way ANOVA with Dunnett’s test. *P < 0.05; **P < 0.01; ***P < 0.001; ****P < 0.0001.
Fig. 4.
Fig. 4.. Leptin neutralization attenuates liver fibrosis.
(A) Experimental setup of Mup-uPA– and HFD-induced liver fibrosis. (B) H&E and Masson’s trichome staining of the liver. Representative microphotographs are shown (n = 5 per group). The scale bar equals 125 μm. (C and D) RT-qPCR analysis of fibrotic (C) and inflammatory gene (D) mRNA expression in the liver (n = 4 to 7 per group). (E) Serum AST (n = 4 per group). (F and G) Immunofluorescence staining of FN and COL1 of the liver. Representative microphotographs are shown (n = 5 per group). The scale bar equals 100 μm. [(C) to (G)] Data are presented as the means ± SEM and were analyzed by a two-tailed Student’s t test or one-way ANOVA with Dunnett’s test. *P < 0.05; **P < 0.01.
Fig. 5.
Fig. 5.. Leptin neutralization alleviates lung fibrosis.
(A) Experimental setup of bleomycin (BLM)–induced lung fibrosis. (B) H&E and Masson’s trichome staining of lungs. Representative microphotographs are shown (n = 4 per group). For H&E staining, the scale bar equals 125 μm. For trichrome staining, the scale bar equals 500 μm. (C) Volcano plots display the fold change (x axis) versus adjusted P value (y axis) of transcriptomic data from mice treated with bleomycin or vehicle, followed by IgG (IgGL) or leptin antibody (LepL) administration. Mean values from n = 3 mice per group. (D) Gene clusters identified from hierarchical clustering, with selected clusters annotated by GO term enrichment analysis comparing IgG-treated (IgGL) and leptin antibody–treated (LepL) groups. (E) RT-qPCR analysis of fibrotic gene mRNA expression in the lung (n = 6 to 12 per group). (F) RT-qPCR analysis of inflammatory gene mRNA expression in the lung (n = 4 to 7 per group). (G to I) Immunofluorescence staining of FN (E) and CHP (F) of the lung and quantification of immunofluorescence staining of FN and CHP in the lung (I). Representative microphotographs are shown (n = 7 per group). The scale bar equals 100 μm. (J) Venn diagram showing the overlap of down-regulated genes in kidney and lung tissues after LepAb treatment. (K) Top 28 overlapping down-regulated genes identified on the basis of log2 fold change and adjusted P value common to the kidney and lung. (L) GO enrichment analysis of 266 shared down-regulated genes. Data are presented as the means ± SEM and were analyzed by a one-way ANOVA with Dunnett’s test or a two-tailed Student’s t test. *P < 0.05; **P < 0.01. FN+, FN-positive; CHP+, CHP-positive.
Fig. 6.
Fig. 6.. Leptin neutralization mitigates aorta and kidney fibrosis but not heart fibrosis.
(A and B) H&E and Masson’s trichome staining of the kidney. Representative microphotographs (A) and quantification (B) are shown (n = 3 to 5 mice per group; 3 or 4 sections per mouse for quantification). For H&E staining, the scale bar equals 100 μm. For Masson’s trichome staining, the scale bar equals 50 μm (C) RT-qPCR analysis of fibrotic gene mRNA expression in the kidney (n = 3 to 6 per group). (D and E) H&E and Masson’s trichome staining of the kidney. Representative microphotographs (D) and quantification (E) are shown (n = 3 to 5 mice per group; 3 or 4 sections per mouse for quantification). The scale bar equals 50 μm. a.u., arbitrary units. (F) RT-qPCR analysis of fibrotic gene mRNA expression in the aorta (n = 3 to 5 mice per group). The scale bar equals 50 μm. Data are presented as the means ± SEM and were analyzed by a one-way ANOVA. *P < 0.05; **P < 0.01; **** P < 0.0001.

References

    1. Zhang Y., Proenca R., Maffei M., Barone M., Leopold L., Friedman J. M., Positional cloning of the mouse obese gene and its human homologue. Nature 372, 425–432 (1994). - PubMed
    1. Caro J. F., Sinha M. K., Kolaczynski J. W., Zhang P. L., Considine R. V., Leptin: The tale of an obesity gene. Diabetes 45, 1455–1462 (1996). - PubMed
    1. Pan W. W., Myers M. G. Jr., Leptin and the maintenance of elevated body weight. Nat. Rev. Neurosci. 19, 95–105 (2018). - PubMed
    1. Barash I. A., Cheung C. C., Weigle D. S., Ren H., Kabigting E. B., Kuijper J. L., Clifton D. K., Steiner R. A., Leptin is a metabolic signal to the reproductive system. Endocrinology 137, 3144–3147 (1996). - PubMed
    1. Zhao S., Zhu Y., Schultz R. D., Li N., He Z., Zhang Z., Caron A., Zhu Q., Sun K., Xiong W., Deng H., Sun J., Deng Y., Kim M., Lee C. E., Gordillo R., Liu T., Odle A. K., Childs G. V., Zhang N., Kusminski C. M., Elmquist J. K., Williams K. W., An Z., Scherer P. E., Partial leptin reduction as an insulin sensitization and weight loss strategy. Cell Metab. 30, 706–719.e6 (2019). - PMC - PubMed

LinkOut - more resources