. 2025 Oct 22;16(1):9325.
doi: 10.1038/s41467-025-64361-7.

Targeting VGLL4 maintains extracellular matrix homeostasis and mitigates osteoarthritis in a preclinical model

Affiliations

Targeting VGLL4 maintains extracellular matrix homeostasis and mitigates osteoarthritis in a preclinical model

Jinlong Suo et al. Nat Commun. .

Abstract

Extracellular matrix homeostasis is crucial for hyaline cartilage integrity, however, the mechanism of extracellular matrix homeostasis in hyaline cartilage is poorly understood. Single-cell sequencing shows that VGLL4 is highly expressed in chondrocytes but declines after injury/aging. VGLL4 deficiency impairs collagen/elastin formation, causes extracellular matrix disorganization and osteoarthritis in Col2-CreERT2; Vgll4fl/fl mice, and is exacerbated by destabilization of the medial meniscus surgery. Mechanistically, the VGLL4-TEAD-SMAD3 complex maintains extracellular matrix homeostasis through specific interactions: TEAD4 (E263/D266/ Q269/H427) binds SMAD3 (K81/F260) via hydrogen bonds and hydrophobic contacts, while VGLL4 (H240/F241) engages TEAD4 (F337/F373) through π-stacking. Notably, intra-articular delivery of adeno-associated virus encoding either SMAD3 or VGLL4 effectively ameliorates osteoarthritis pathology, whereas interaction-deficient mutants lose therapeutic efficacy. This study demonstrates that VGLL4 serves as a critical regulator of extracellular matrix homeostasis in chondrocytes. The VGLL4 complex represents a potential therapeutic target for treating osteoarthritis and cartilage fibrosis.


Conflict of interest statement

Competing interests: The authors declare no competing interests.

Figures

Fig. 1
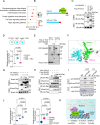
Fig. 1. Downregulation of VGLL4 after cartilage damage and aging.
A Mouse Prx1-Ai9 labeled BMSCs, OBs, PMSCs and chondrocytes. BMSCs: bone marrow stromal cells; OBs: osteoblasts; PMSCs: periosteum mesenchymal stem cells. Dot plot showing genetic characterization of genes in different cellular taxa. B Violin plot showing the expression profile of VGLL4 in BMSCs, OBs, PMSCs and chondrocytes. C Single cell sequencing of articular cartilage from three healthy men was analyzed. D The tSNE plot shows the clustering of human articular cartilage single cell sequencing. EC: Effector chondrocyte; FC: Fibrocartilage chondrocyte; HomC: Homeostasis chondrocyte; HTC: Hypertrophic chondrocyte; MERNL+: MERNL+ chondrocyte; Pre-HTC: Prehypertrophic chondrocyte; PRG4+: PRG4+ chondrocyte; RegC: Regulatory chondrocyte. tSNE plot (E) and Violin plot (F) showing the expression profile of VGLL4 in human articular chondrocytes. G Workflow of the experiments used to evaluate the osteoarthritic phenotypes of Vgll4eGFP mice after DMM surgery. H SO&FG staining of knee joint sections from Vgll4eGFP mice. Scale bar = 200 μm. n = 5 samples per group. I Quantification of the indicated OARSI score in (H). Unpaired t tests (Two-tailed), means ± SEMs. n = 5 samples per group. J Immunofluorescence staining for GFP expression in the Vgll4eGFP mice. Scale bar = 100 μm. n = 5 samples per group. K Quantification of the indicated GFP signal Integrated Density in (J) by ImageJ. Unpaired t tests (Two-tailed), means ± SEMs. n = 5 per group. Boxes: 25th–75th percentiles; centre line: median; whiskers: 1.5×IQR. L Experimental procedures for assessing osteoarthritic phenotypes in the 7-month-old and 6-week-old Vgll4eGFP mice. M SO&FG staining of knee joint sections from the 7-month-old and 6-week-old Vgll4eGFP mice. Scale bar = 200 μm. n = 6 samples per group. N Quantification of the indicated OARSI score in (M). Unpaired t tests (Two-tailed), means ± SEMs. n = 6 samples per group. O Immunofluorescence staining for GFP expression was performed from Vgll4eGFP mice. Scale bar = 100 μm. n = 4 samples per group. P Quantification of the indicated GFP signal Integrated Density in (O) by ImageJ. Unpaired t tests (Two-tailed), means ± SEMs. n = 4 samples per group. Boxes: 25th–75th percentiles; centre line: median; whiskers: 1.5×IQR. Fig. 1C, 1G, 1L: Created in BioRender. Suo, J. (2025) https://BioRender.com/ecujlzt.
Fig. 2
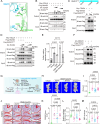
Fig. 2. VGLL4 promotes the maintenance of extracellular matrix homeostasis in cartilage.
A Volcano plot showing transcriptomic changes in chondrocytes from Vgll4–/– mice. Fold change ≥1.5, p value < 0.05. RNA data were analyzed using two-sided analysis (AE). B Gene Ontology (GO) biological process (BP) analysis of downregulated genes in Vgll4 knockout cartilage compared with control cartilage. C GO cellular component (CC) analysis of downregulated genes in Vgll4 knockout cartilage compared with control cartilage. D GO molecular function (MF) analysis of downregulated genes in Vgll4 knockout cartilage compared with control cartilage. E Reactome analysis of downregulated genes in Vgll4 knockout cartilage compared with control cartilage. F Heatmap showing transcriptome changes in cartilage from Vgll4–/– mice. The downregulated cartilage anabolism-related genes are listed on the right side of the figure. G Knockdown of Vgll4 in chondrocytes of Vgll4fl/fl mice by infection with Cre lentivirus, and the cells were cultured in micromass and stained with alcian blue on the 7th day of induced chondrocyte differentiation. RT‒PCR was performed to detect the expression levels of Vgll4 (H) and the collagen formation marker Col2a1 (I). The data are presented as the means ± SEMs. Unpaired t tests (Two-tailed), n = 4 per group. Boxes: 25th–75th percentiles; centre line: median; whiskers: 1.5×IQR.
Fig. 3
Fig. 3. Articular cartilage extracellular matrix disorders in Vgll4 CKO mice.
A Schematic illustration of the construction of an animal model of articular chondrocyte-specific Vgll4 knockout in mice. CKO: Col2CreERT2; Vgll4fl/fl. B Immunofluorescence staining for VGLL4 expression was performed on frozen sections of joints from 30-week-old CKO and littermate control mice. Red: VGLL4; blue: DAPI. Scale bar = 100 μm. C Workflow of the experiments used to evaluate the osteoarthritic phenotypes of the CKO mice after DMM surgery. D Representative micro-CT scans showing the volumes of the calcified meniscus and synovium (Marked in red). mice: n = 9, 8, 9, 8. E Quantification of calcified meniscus and synovial tissue volume in (D). Ordinary one-way ANOVA, means ± SEMs. mice: n = 9, 8, 9, 8. F SO&FG staining of female mouse knee joints. Scale bar = 500 μm (top), 200 μm (bottom). mice: n = 9, 8, 9, 8. The image below is an enlarged image of a portion of the above image. G Quantification of the indicated OARSI score in (F). Ordinary one-way ANOVA, means ± SEMs. mice: n = 9, 8, 9, 8. H Quantification of the relative cartilage thickness in (F). Ordinary one-way ANOVA, means ± SEMs. mice: n = 9, 8, 9, 8. I Quantification of the indicated relative SBP thickness in (F). SBP, subchondral bone plate. Ordinary one-way ANOVA, means ± SEMs. mice: n = 9, 8, 9, 8. J Immunofluorescence staining for COL2 expression was performed on paraffin-embedded joint sections. Scale bar = 200 μm. K Quantitative statistics of the proportion of COL2-positive cell areas (%) in (J) were performed by ImageJ software. Ordinary one-way ANOVA, means ± SEMs. n = 6 samples per group. L Immunofluorescence staining for COL1 expression was performed on paraffin-embedded joint sections. Scale bar = 200 μm. M Quantitative statistics of the proportion of COL1-positive cell areas (%) in (L) were performed by ImageJ software. Ordinary one-way ANOVA, means ± SEMs. n = 6 samples per group. N VGLL4 expression was reduced after cartilage injury, and VGLL4 deficiency resulting in hyaline cartilage degradation and transformation to fibrocartilage. Fig. 3c, 3n: Created in BioRender. Suo, J. (2025) https://BioRender.com/ecujlzt.
Fig. 4
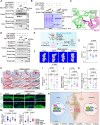
Fig. 4. TEAD4 mediates the interactions between VGLL4 and SMAD3.
A KEGG analysis of downregulated genes in Vgll4–/– mouse chondrocytes. B Schematic of the VGLL4 TDU domain at the full-length position of the VGLL4 protein. The TEAD4 protein binds to the TDU domain (top). Schematic of the VGLL4 ΔTDU build (bottom). C Co-immunoprecipitation experiments of SMAD3 (HA tag) and VGLL4/VGLL4 ΔTDU (Flag tag) in HEK-293T cells. IP: Flag. D Chondrocytes infected with Gfp (Control), Vgll4 or Vgll4 ΔTDU lentivirus were cultured in micromass and stained with alcian blue on the 7th day of induced chondrocyte differentiation (top). RT‒PCR was performed to determine the expression levels of Col2a1 (bottom). Boxes: 25th–75th percentiles; centre line: median; whiskers: 1.5×IQR. E GST pulldown analysis of purified GST-SMAD3 and VGLL4 TDU proteins. F Overall SMAD3-TEAD4-VGLL4 complex structural model predicted by AlphaFold2. SMAD3, TEAD4 and VGLL4 are shown in cyan, green and magenta, respectively. G Co-immunoprecipitation experiments of SMAD3 (HA tag) and TEAD1/2/3/4 (Flag tag) in HEK-293T cells. IP: Flag. H Co-immunoprecipitation experiments of TEAD4 (HA tag), SMAD3 (Flag tag) and VGLL4 (Myc tag) in HEK-293T cells. IP: Flag. I Co-immunoprecipitation experiments of SMAD3 and TEADs in the chondrocytes of the Vgll4fl/fl mice treated with GFP or Cre lentivirus. IP: Pan-TEAD. J RT‒PCR was performed to determine the gene expression of Col2a1 and Acan in chondrocytes after infection with the Control, Smad3, Vgll4 or Smad3+Vgll4 lentivirus in chondrocytes. Ordinary one-way ANOVA was used, and the data are presented as the means ± SEMs. n = 4 per group. Boxes: 25th–75th percentiles; centre line: median; whiskers: 1.5×IQR. K Model diagram of the function of the VGLL4-TEAD4-SMAD3 complex.
Fig. 5
Fig. 5. SMAD3 depends on binding to TEADs to alleviate OA.
A Interface between SMAD3 and TEAD4. The residues involved in hydrophobic contact and hydrogen bonds (orange dashed lines) are labeled. B Co-immunoprecipitation experiments of TEAD4 and TEAD4 mut4 (HA tag), VGLL4 (Myc tag), and SMAD3 (Flag tag) in HEK-293T cells. IP: Flag. C Co-immunoprecipitation experiments of TEAD4 (Myc tag), SMAD3 and Smad3K81A/F260A (Flag tag) in HEK-293T cells. IP: Flag. D Co-immunoprecipitation experiments of TEAD4 (HA tag), VGLL4 (Myc tag), SMAD3 and Smad3K81A/F260A (Flag tag) in HEK-293T cells. IP: Flag. E RT‒PCR analysis of Col2a1 gene expression in chondrocytes after infection with the Control, Smad3, Vgll4, Smad3+Vgll4 or Smad3K81A/F260A+Vgll4 lentivirus. Ordinary one-way ANOVA was used, and the data are presented as the means ± SEMs. n = 3 per group. F Co-immunoprecipitation experiments of SMAD3 (HA tag) and TEAD4/TEAD4 Y429H (Flag tag) in HEK-293T cells. IP: Flag. G Experimental procedure for assessing the effects of articular injection of Smad3 and Smad3KF2A AAV on the osteoarthritic phenotype in wild-type mice after sham or DMM surgery. H Representative micro-CT scans showing the volumes of the calcified meniscus and synovium (Marked in red). n = 12 samples per group. I Quantification of calcified meniscus and synovial tissue volume in (H). Ordinary one-way ANOVA was used, and the data are presented as the means ± SEMs. n = 12 samples per group. J SO&FG staining of sections of the mouse knee joint. Scale bar = 500 μm (top), 200 μm (bottom). n = 10 samples per group. The image below is an enlarged image of a portion of the above image. K Quantification of the indicated OARSI score in (J). Ordinary one-way ANOVA, means ± SEMs. n = 10 samples per group. L Quantification of the relative cartilage thickness in (J). Ordinary one-way ANOVA, means ± SEMs. n = 10 samples per group. M Quantification of the indicated relative SBP thickness in (J). SBP, subchondral bone plate. Ordinary one-way ANOVA, means ± SEMs. n = 10 samples per group. Fig. 5g: Created in BioRender. Suo, J. (2025) https://BioRender.com/ecujlzt.
Fig. 6
Fig. 6. VGLL4 increases the binding of TEAD4 to SMAD3 and promotes extracellular matrix homeostasis.
A Co-immunoprecipitation experiments of TEAD4 (Flag tag), SMAD3 (HA tag), VGLL4 (Myc tag) and VGLL4 ΔTDU (Myc tag) in HEK-293T cells. IP: Flag. B GST pulldown analysis of purified GST-SMAD3, VGLL4 TDU and Flag TEAD4 proteins. C The TEAD4 binding pocket of VGLL4. The residues involved in the π-π-π-π and van der Waals interactions are shown as stick models. D Co-immunoprecipitation experiments of VGLL4 and VGLL4 HF4A (Myc tag), SMAD3 (Flag tag) and TEAD4 (HA tag) in HEK-293T cells. IP: Flag. E Experimental procedure to assess the effect of articular injection of Vgll4 and Vgll4HF4A AAV on the osteoarthritic phenotype in wild-type mice after DMM surgery. F Representative micro-CT scans showing the volumes of the calcified meniscus and synovium (Marked in red). mice: n = 10, 9, 10, 10. G Quantification of calcified meniscus and synovial tissue volume in (F). Ordinary one-way ANOVA, means ± SEMs. mice: n = 10, 9, 10, 10. H SO&FG staining of sections of the mouse knee joint. Scale bar = 500 μm (top), 200 μm (bottom). mice: n = 10, 9, 10, 10. The image below is an enlarged image of a portion of the above image. I Quantification of the indicated OARSI score in (H). Ordinary one-way ANOVA, means ± SEMs. mice: n = 10, 9, 10, 10. J Quantification of the relative cartilage thickness in (H). Ordinary one-way ANOVA, means ± SEMs. mice: n = 10, 9, 10, 10. K Quantification of the indicated relative SBP thickness in (H). SBP, subchondral bone plate. Ordinary one-way ANOVA, means ± SEMs. mice: n = 10, 9, 10, 10. L Immunofluorescence staining for COL2 and COL1 expression was performed on paraffin-embedded joint sections. Scale bar = 200 μm. n = 6 Samples per group. M Quantitative statistics of the proportion of COL2 or COL1-positive cell areas (%) in (L) were performed by ImageJ software. Ordinary one-way ANOVA, means ± SEMs. n = 6 Samples per group. N Schematic representation of VGLL4 function in cartilage. Fig. 6e: Created in BioRender. Suo, J. (2025) https://BioRender.com/ecujlzt.

References

    1. Loeser, R. F. et al. Microarray analysis reveals age-related differences in gene expression during the development of osteoarthritis in mice. Arthritis Rheum.64, 705–717 (2012). - PMC - PubMed
    1. Liu, Q. et al. DDX5 inhibits hyaline cartilage fibrosis and degradation in osteoarthritis via alternative splicing and G-quadruplex unwinding. Nat. Aging4, 664–680 (2024). - PMC - PubMed
    1. Nordberg, R. C. et al. Recent advancements in cartilage tissue engineering innovation and translation. Nat. Rev. Rheumatol.20, 323–346 (2024). - PMC - PubMed
    1. Humphrey, J. D., Dufresne, E. R. & Schwartz, M. A. Mechanotransduction and extracellular matrix homeostasis. Nat. Rev. Mol. Cell Biol.15, 802–812 (2014). - PMC - PubMed
    1. Li, K. et al. Anti-inflammatory and pro-anabolic effects of 5-aminosalicylic acid on human inflammatory osteoarthritis models. J. Orthop. Transl.38, 106–116 (2023). - PMC - PubMed

MeSH terms