

Mass spectrometry combined with machine learning identifies novel protein signatures as demonstrated with multisystem inflammatory syndrome in children
- PMID: 41125642
- PMCID: PMC12546946
- DOI: 10.1038/s41598-025-20684-5
Mass spectrometry combined with machine learning identifies novel protein signatures as demonstrated with multisystem inflammatory syndrome in children
Abstract
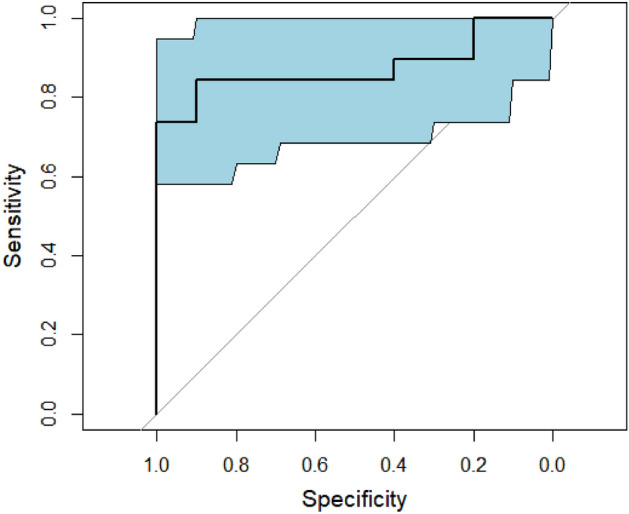
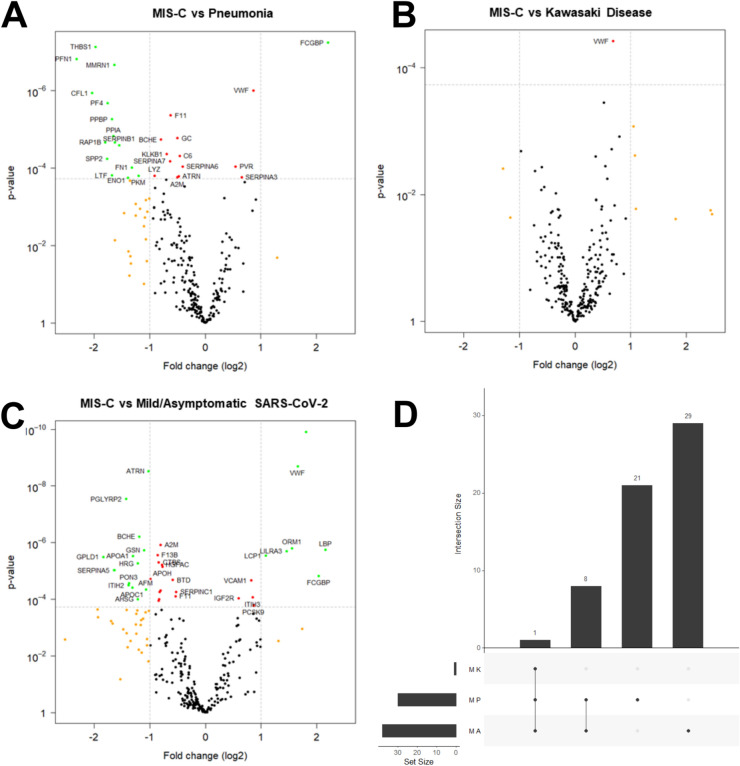
Rapid and accurate diagnosis of emerging inflammatory illnesses is challenging due to overlapping clinical features with existing conditions. We demonstrate an approach that integrates proteomic analysis with machine learning to identify diagnostic protein signatures, using the example of SARS-CoV-2-induced multisystem inflammatory syndrome in children (MIS-C). We used plasma samples collected from subjects diagnosed with MIS-C and compared them first to controls with asymptomatic/mild SARS-CoV-2 infection and then to controls with pneumonia or Kawasaki disease. We used mass spectrometry to identify proteins and support vector machine (SVM) algorithm-based classification schemes to identify protein signatures. Diagnostic accuracy was assessed by calculating sensitivity, specificity, and area under the ROC curve (AUC), and corrected for overfitting by cross-validation. Proteomic analysis of a training dataset containing MIS-C (N = 17), and asymptomatic/mild SARS-CoV-2 infected control samples (N = 20) identified 643 proteins, of which 101 were differentially expressed. Plasma proteins associated with inflammation increased, and those associated with metabolism and coagulation decreased in MIS-C relative to controls. The SVM machine learning algorithm identified a three-protein model (ORM1, AZGP1, SERPINA3) that achieved 90.0% specificity, 88.2% sensitivity, and 93.5% AUC, distinguishing MIS-C from controls in the training set. Performance was retained in the validation dataset utilizing MIS-C (N = 19) and asymptomatic/mild SARS-CoV-2 infected control samples (N = 10) (90.0% specificity, 84.2% sensitivity, 87.4% AUC). We next replicated our approach to compare MIS-C with similarly presenting syndromes, such as pneumonia (N = 17) and Kawasaki disease (N = 13), and found a distinct three-protein signature (VWF, FCGBP, and SERPINA3) that accurately distinguished MIS-C from the other conditions (97.5% specificity, 89.5% sensitivity, 95.6% AUC). A software tool was also developed that may be used to evaluate other protein signatures using our data. These results demonstrate that the use of mass spectrometry to identify candidate plasma proteins followed by machine learning, specifically SVM, is an efficient strategy for identifying and evaluating biomarker signatures for disease classification.
Keywords: Biomarkers; Hyperinflammatory illnesses; Long COVID; Support vector machine.
© 2025. The Author(s).
Conflict of interest statement
Declarations. Competing interests: The authors declare no competing interests. Study approval: All study activities were approved by the Rutgers Institutional Review Board (Pro2020002961) and all methods were performed in accordance with the relevant guidelines. All participants, including parents and/or legal guardians, provided informed consent prior to engaging in study activities.
Figures


Update of
-
Combining Mass Spectrometry with Machine Learning to Identify Novel Protein Signatures: The Example of Multisystem Inflammatory Syndrome in Children.medRxiv [Preprint]. 2025 Apr 25:2025.04.17.25325767. doi: 10.1101/2025.04.17.25325767. medRxiv. 2025. Update in: Sci Rep. 2025 Oct 22;15(1):36843. doi: 10.1038/s41598-025-20684-5. PMID: 40313298 Free PMC article. Updated. Preprint.
References
-
- Philadelphia TCsHo. Multisystem inflammatory syndrome (MIS-C) clinical pathway chop.edu (2021). Available from: https://pathways.chop.edu/clinical-pathway/multisystem-inflammatory-synd....
-
- Reiter, A. et al. Proteomic mapping identifies serum marker signatures associated with MIS-C specific hyperinflammation and cardiovascular manifestation. Clin. Immunol.264, 110237 (2024). - PubMed
MeSH terms
Substances
Supplementary concepts
Grants and funding
LinkOut - more resources
Full Text Sources
Medical
Miscellaneous
