

Association between metabolic health status and chronic kidney disease in the population of the northern region of Senegal: a cross-sectional study
- PMID: 41126084
- PMCID: PMC12541931
- DOI: 10.1186/s12882-025-04448-x
Association between metabolic health status and chronic kidney disease in the population of the northern region of Senegal: a cross-sectional study
Abstract
Introduction: Chronic kidney disease (CKD) is a major public health problem worldwide. Data have shown the deleterious effects of metabolic abnormalities such as diabetes, hypertension and dyslipidemia on the occurrence of CKD. Obesity also contributes to this deterioration of kidney function. The objective of this study was to examine the proportion CKD and its associated risk factors within the different categories of metabolic health status.
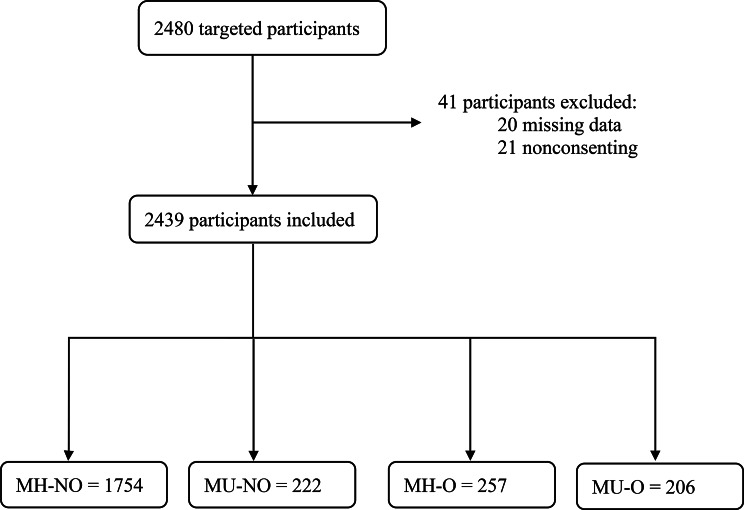
Patients and methods: We conducted a cross-sectional study in the general population of three northern regions in Senegal using a two-level cluster sampling method. The sample was constituted with a precision of 5%, a power of 80% and a 10% attrition margin. Individuals aged 18–80 years were included in the study after giving their consent. Pregnant women, hospitalized persons within the past three months, patients with general or urinary symptoms within the past seven days and individuals undergoing kidney replacement therapy were excluded. Clinical and biological data were collected at participants’ homes by investigators using a modified version of the world health organization (WHO)’s STEPwise questionnaire.
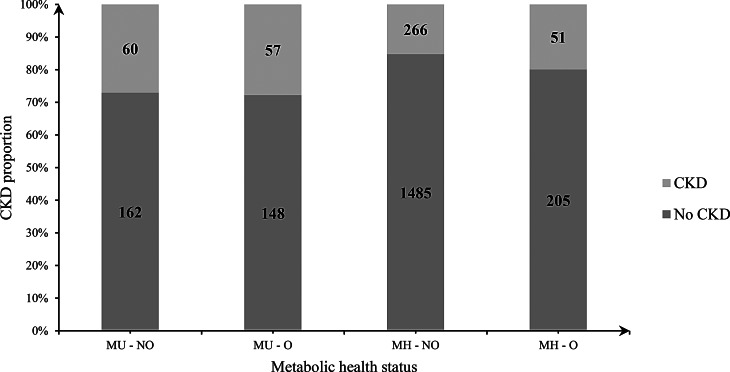
Results: A total of 2439 participants were included in the study with a mean age of 45.4 ± 16.0 years and a sex ratio M: F of 2:5. Overall proportion of Metabolically Healthy No Obesity (MH-NO), Metabolically Unhealthy No Obesity (MU-NO), Metabolically Healthy Obesity (MH-O) and Metabolically Unhealthy Obesity (MU-O) were 79.9%, 9.1%, 10.5% and 8.4% respectively. Four hundred and thirty-five participants (17.8%) had CKD. Prevalence rates of CKD were higher among metabolically unhealthy phenotype participants regardless their body mass index (BMI), 27.0% in MU-NO and 27.8% in MU-O. In metabolically healthy participants those with obesity had a higher proportion of CKD (20.2%) compared to those without obesity (15.2%). In univariate analysis, MH-O and MU-O were significantly associated with CKD. In multivariate adjusted analysis, the odds of having CKD were higher in MU-O (OR: 2.15; 95% CI: 1.53, 2.98) and MU-NO (OR: 2.07; 95% CI: 1.49, 2.84) in the crude model. However, the association was not significative after adjustment for potential confounders.
Conclusion: Unhealthy metabolic phenotype and obesity were common in this cohort and were associated with a significant high prevalence of CKD compared to healthy participants. That prevalence appears to be even higher in individuals with both metabolically unhealthy phenotype and obesity.
Keywords: Chronic kidney disease; Metabolic health; Obesity; Senegal.
Conflict of interest statement
Declarations. Ethical approval: The study was conducted in accordance with the Declaration of Helsinki, and the study protocol was approved by the internal review board for ethical issues (n°0021/CER/UCAD). A form of informed consent was signed by participants to agree to data collection. All participants were personally informed of their screening results, and those with abnormal values were referred to a specialist for further investigation and treatment. Consent for publication: Not applicable. Competing interests: The authors declare no competing interests.
Figures

References
-
- Wang H, Naghavi M, Allen C, Barber RM, Bhutta ZA, Carter A, et al. Global, regional, and National life expectancy, all-cause mortality, and cause-specific mortality for 249 causes of death, 1980–2015: a systematic analysis for the global burden of disease study 2015. Lancet. Oct 2016;8(10053):1459–544. - PMC - PubMed
LinkOut - more resources
Full Text Sources
Research Materials
Miscellaneous
